Updated: 3rd June 2025
This page provides constituency-level data on composite IMD scores (2020). See the notes below .
Skip hex cartogram
most deprived
least deprived
Hexmap
<strong>Aberafan Maesteg</strong><br>Deprivation score: <strong>32.4%</strong> <strong>Aberdeen North</strong><br>Deprivation score: <strong>17.0%</strong> <strong>Aberdeen South</strong><br>Deprivation score: <strong>12.8%</strong> <strong>Aberdeenshire North and Moray East</strong><br>Deprivation score: <strong>17.1%</strong> <strong>Airdrie and Shotts</strong><br>Deprivation score: <strong>27.1%</strong> <strong>Aldershot</strong><br>Deprivation score: <strong>14.6%</strong> <strong>Aldridge-Brownhills</strong><br>Deprivation score: <strong>17.8%</strong> <strong>Alloa and Grangemouth</strong><br>Deprivation score: <strong>21.1%</strong> <strong>Altrincham and Sale West</strong><br>Deprivation score: <strong>10.7%</strong> <strong>Alyn and Deeside</strong><br>Deprivation score: <strong>17.1%</strong> <strong>Amber Valley</strong><br>Deprivation score: <strong>20.8%</strong> <strong>Angus and Perthshire Glens</strong><br>Deprivation score: <strong>15.3%</strong> <strong>Arbroath and Broughty Ferry</strong><br>Deprivation score: <strong>19.9%</strong> <strong>Argyll, Bute and South Lochaber</strong><br>Deprivation score: <strong>17.1%</strong> <strong>Arundel and South Downs</strong><br>Deprivation score: <strong>12.1%</strong> <strong>Ashfield</strong><br>Deprivation score: <strong>27.4%</strong> <strong>Ashford</strong><br>Deprivation score: <strong>18.2%</strong> <strong>Ashton-under-Lyne</strong><br>Deprivation score: <strong>34.3%</strong> <strong>Aylesbury</strong><br>Deprivation score: <strong>13.2%</strong> <strong>Ayr, Carrick and Cumnock</strong><br>Deprivation score: <strong>25.1%</strong> <strong>Banbury</strong><br>Deprivation score: <strong>15.6%</strong> <strong>Bangor Aberconwy</strong><br>Deprivation score: <strong>17.6%</strong> <strong>Barking</strong><br>Deprivation score: <strong>33.5%</strong> <strong>Barnsley North</strong><br>Deprivation score: <strong>30.6%</strong> <strong>Barnsley South</strong><br>Deprivation score: <strong>35.1%</strong> <strong>Barrow and Furness</strong><br>Deprivation score: <strong>26.9%</strong> <strong>Basildon and Billericay</strong><br>Deprivation score: <strong>23.8%</strong> <strong>Basingstoke</strong><br>Deprivation score: <strong>15.0%</strong> <strong>Bassetlaw</strong><br>Deprivation score: <strong>23.4%</strong> <strong>Bath</strong><br>Deprivation score: <strong>11.7%</strong> <strong>Bathgate and Linlithgow</strong><br>Deprivation score: <strong>18.6%</strong> <strong>Battersea</strong><br>Deprivation score: <strong>17.0%</strong> <strong>Beaconsfield</strong><br>Deprivation score: <strong>8.9%</strong> <strong>Beckenham and Penge</strong><br>Deprivation score: <strong>14.0%</strong> <strong>Bedford</strong><br>Deprivation score: <strong>22.9%</strong> <strong>Belfast East</strong><br>Deprivation score: <strong>38.1%</strong> <strong>Belfast North</strong><br>Deprivation score: <strong>60.5%</strong> <strong>Belfast South and Mid Down</strong><br>Deprivation score: <strong>34.8%</strong> <strong>Belfast West</strong><br>Deprivation score: <strong>72.5%</strong> <strong>Bermondsey and Old Southwark</strong><br>Deprivation score: <strong>24.3%</strong> <strong>Berwickshire, Roxburgh and Selkirk</strong><br>Deprivation score: <strong>16.9%</strong> <strong>Bethnal Green and Stepney</strong><br>Deprivation score: <strong>30.1%</strong> <strong>Beverley and Holderness</strong><br>Deprivation score: <strong>15.3%</strong> <strong>Bexhill and Battle</strong><br>Deprivation score: <strong>18.3%</strong> <strong>Bexleyheath and Crayford</strong><br>Deprivation score: <strong>17.3%</strong> <strong>Bicester and Woodstock</strong><br>Deprivation score: <strong>10.6%</strong> <strong>Birkenhead</strong><br>Deprivation score: <strong>39.6%</strong> <strong>Birmingham Edgbaston</strong><br>Deprivation score: <strong>32.5%</strong> <strong>Birmingham Erdington</strong><br>Deprivation score: <strong>42.4%</strong> <strong>Birmingham Hall Green and Moseley</strong><br>Deprivation score: <strong>38.5%</strong> <strong>Birmingham Hodge Hill and Solihull North</strong><br>Deprivation score: <strong>45.6%</strong> <strong>Birmingham Ladywood</strong><br>Deprivation score: <strong>48.6%</strong> <strong>Birmingham Northfield</strong><br>Deprivation score: <strong>39.1%</strong> <strong>Birmingham Perry Barr</strong><br>Deprivation score: <strong>42.1%</strong> <strong>Birmingham Selly Oak</strong><br>Deprivation score: <strong>31.0%</strong> <strong>Birmingham Yardley</strong><br>Deprivation score: <strong>41.4%</strong> <strong>Bishop Auckland</strong><br>Deprivation score: <strong>28.9%</strong> <strong>Blackburn</strong><br>Deprivation score: <strong>38.7%</strong> <strong>Blackley and Middleton South</strong><br>Deprivation score: <strong>43.6%</strong> <strong>Blackpool North and Fleetwood</strong><br>Deprivation score: <strong>27.2%</strong> <strong>Blackpool South</strong><br>Deprivation score: <strong>50.5%</strong> <strong>Blaenau Gwent and Rhymney</strong><br>Deprivation score: <strong>34.1%</strong> <strong>Blaydon and Consett</strong><br>Deprivation score: <strong>21.1%</strong> <strong>Blyth and Ashington</strong><br>Deprivation score: <strong>33.1%</strong> <strong>Bognor Regis and Littlehampton</strong><br>Deprivation score: <strong>21.2%</strong> <strong>Bolsover</strong><br>Deprivation score: <strong>24.5%</strong> <strong>Bolton North East</strong><br>Deprivation score: <strong>33.8%</strong> <strong>Bolton South and Walkden</strong><br>Deprivation score: <strong>40.5%</strong> <strong>Bolton West</strong><br>Deprivation score: <strong>20.8%</strong> <strong>Bootle</strong><br>Deprivation score: <strong>41.8%</strong> <strong>Boston and Skegness</strong><br>Deprivation score: <strong>29.7%</strong> <strong>Bournemouth East</strong><br>Deprivation score: <strong>21.5%</strong> <strong>Bournemouth West</strong><br>Deprivation score: <strong>21.8%</strong> <strong>Bracknell</strong><br>Deprivation score: <strong>11.2%</strong> <strong>Bradford East</strong><br>Deprivation score: <strong>44.6%</strong> <strong>Bradford South</strong><br>Deprivation score: <strong>39.7%</strong> <strong>Bradford West</strong><br>Deprivation score: <strong>42.2%</strong> <strong>Braintree</strong><br>Deprivation score: <strong>14.4%</strong> <strong>Brecon, Radnor and Cwm Tawe</strong><br>Deprivation score: <strong>18.5%</strong> <strong>Brent East</strong><br>Deprivation score: <strong>29.4%</strong> <strong>Brent West</strong><br>Deprivation score: <strong>21.4%</strong> <strong>Brentford and Isleworth</strong><br>Deprivation score: <strong>20.6%</strong> <strong>Brentwood and Ongar</strong><br>Deprivation score: <strong>11.6%</strong> <strong>Bridgend</strong><br>Deprivation score: <strong>17.7%</strong> <strong>Bridgwater</strong><br>Deprivation score: <strong>23.5%</strong> <strong>Bridlington and The Wolds</strong><br>Deprivation score: <strong>22.7%</strong> <strong>Brigg and Immingham</strong><br>Deprivation score: <strong>16.3%</strong> <strong>Brighton Kemptown and Peacehaven</strong><br>Deprivation score: <strong>27.4%</strong> <strong>Brighton Pavilion</strong><br>Deprivation score: <strong>17.9%</strong> <strong>Bristol Central</strong><br>Deprivation score: <strong>18.8%</strong> <strong>Bristol East</strong><br>Deprivation score: <strong>30.5%</strong> <strong>Bristol North East</strong><br>Deprivation score: <strong>24.2%</strong> <strong>Bristol North West</strong><br>Deprivation score: <strong>21.2%</strong> <strong>Bristol South</strong><br>Deprivation score: <strong>33.8%</strong> <strong>Broadland and Fakenham</strong><br>Deprivation score: <strong>14.1%</strong> <strong>Bromley and Biggin Hill</strong><br>Deprivation score: <strong>12.0%</strong> <strong>Bromsgrove</strong><br>Deprivation score: <strong>11.7%</strong> <strong>Broxbourne</strong><br>Deprivation score: <strong>17.4%</strong> <strong>Broxtowe</strong><br>Deprivation score: <strong>14.6%</strong> <strong>Buckingham and Bletchley</strong><br>Deprivation score: <strong>16.6%</strong> <strong>Burnley</strong><br>Deprivation score: <strong>38.2%</strong> <strong>Burton and Uttoxeter</strong><br>Deprivation score: <strong>20.2%</strong> <strong>Bury North</strong><br>Deprivation score: <strong>23.8%</strong> <strong>Bury South</strong><br>Deprivation score: <strong>26.6%</strong> <strong>Bury St Edmunds and Stowmarket</strong><br>Deprivation score: <strong>13.6%</strong> <strong>Caerfyrddin</strong><br>Deprivation score: <strong>19.9%</strong> <strong>Caerphilly</strong><br>Deprivation score: <strong>23.6%</strong> <strong>Caithness, Sutherland and Easter Ross</strong><br>Deprivation score: <strong>18.6%</strong> <strong>Calder Valley</strong><br>Deprivation score: <strong>20.1%</strong> <strong>Camborne and Redruth</strong><br>Deprivation score: <strong>26.1%</strong> <strong>Cambridge</strong><br>Deprivation score: <strong>15.5%</strong> <strong>Cannock Chase</strong><br>Deprivation score: <strong>20.5%</strong> <strong>Canterbury</strong><br>Deprivation score: <strong>15.7%</strong> <strong>Cardiff East</strong><br>Deprivation score: <strong>27.5%</strong> <strong>Cardiff North</strong><br>Deprivation score: <strong>13.8%</strong> <strong>Cardiff South and Penarth</strong><br>Deprivation score: <strong>21.5%</strong> <strong>Cardiff West</strong><br>Deprivation score: <strong>25.2%</strong> <strong>Carlisle</strong><br>Deprivation score: <strong>22.2%</strong> <strong>Carshalton and Wallington</strong><br>Deprivation score: <strong>17.2%</strong> <strong>Castle Point</strong><br>Deprivation score: <strong>17.4%</strong> <strong>Central Ayrshire</strong><br>Deprivation score: <strong>22.9%</strong> <strong>Central Devon</strong><br>Deprivation score: <strong>16.3%</strong> <strong>Central Suffolk and North Ipswich</strong><br>Deprivation score: <strong>14.0%</strong> <strong>Ceredigion Preseli</strong><br>Deprivation score: <strong>18.4%</strong> <strong>Chatham and Aylesford</strong><br>Deprivation score: <strong>24.3%</strong> <strong>Cheadle</strong><br>Deprivation score: <strong>12.3%</strong> <strong>Chelmsford</strong><br>Deprivation score: <strong>12.4%</strong> <strong>Chelsea and Fulham</strong><br>Deprivation score: <strong>17.8%</strong> <strong>Cheltenham</strong><br>Deprivation score: <strong>13.8%</strong> <strong>Chesham and Amersham</strong><br>Deprivation score: <strong>6.8%</strong> <strong>Chester North and Neston</strong><br>Deprivation score: <strong>17.1%</strong> <strong>Chester South and Eddisbury</strong><br>Deprivation score: <strong>12.7%</strong> <strong>Chesterfield</strong><br>Deprivation score: <strong>24.5%</strong> <strong>Chichester</strong><br>Deprivation score: <strong>15.0%</strong> <strong>Chingford and Woodford Green</strong><br>Deprivation score: <strong>18.2%</strong> <strong>Chippenham</strong><br>Deprivation score: <strong>13.0%</strong> <strong>Chipping Barnet</strong><br>Deprivation score: <strong>13.6%</strong> <strong>Chorley</strong><br>Deprivation score: <strong>18.1%</strong> <strong>Christchurch</strong><br>Deprivation score: <strong>11.9%</strong> <strong>Cities of London and Westminster</strong><br>Deprivation score: <strong>16.9%</strong> <strong>City of Durham</strong><br>Deprivation score: <strong>18.7%</strong> <strong>Clacton</strong><br>Deprivation score: <strong>34.3%</strong> <strong>Clapham and Brixton Hill</strong><br>Deprivation score: <strong>25.1%</strong> <strong>Clwyd East</strong><br>Deprivation score: <strong>17.4%</strong> <strong>Clwyd North</strong><br>Deprivation score: <strong>26.6%</strong> <strong>Coatbridge and Bellshill</strong><br>Deprivation score: <strong>28.3%</strong> <strong>Colchester</strong><br>Deprivation score: <strong>19.3%</strong> <strong>Colne Valley</strong><br>Deprivation score: <strong>16.8%</strong> <strong>Congleton</strong><br>Deprivation score: <strong>12.3%</strong> <strong>Corby and East Northamptonshire</strong><br>Deprivation score: <strong>20.2%</strong> <strong>Coventry East</strong><br>Deprivation score: <strong>33.8%</strong> <strong>Coventry North West</strong><br>Deprivation score: <strong>22.5%</strong> <strong>Coventry South</strong><br>Deprivation score: <strong>21.9%</strong> <strong>Cowdenbeath and Kirkcaldy</strong><br>Deprivation score: <strong>20.5%</strong> <strong>Cramlington and Killingworth</strong><br>Deprivation score: <strong>20.4%</strong> <strong>Crawley</strong><br>Deprivation score: <strong>19.0%</strong> <strong>Crewe and Nantwich</strong><br>Deprivation score: <strong>20.1%</strong> <strong>Croydon East</strong><br>Deprivation score: <strong>22.5%</strong> <strong>Croydon South</strong><br>Deprivation score: <strong>14.4%</strong> <strong>Croydon West</strong><br>Deprivation score: <strong>29.6%</strong> <strong>Cumbernauld and Kirkintilloch</strong><br>Deprivation score: <strong>19.0%</strong> <strong>Dagenham and Rainham</strong><br>Deprivation score: <strong>26.7%</strong> <strong>Darlington</strong><br>Deprivation score: <strong>27.1%</strong> <strong>Dartford</strong><br>Deprivation score: <strong>19.7%</strong> <strong>Daventry</strong><br>Deprivation score: <strong>13.0%</strong> <strong>Derby North</strong><br>Deprivation score: <strong>23.1%</strong> <strong>Derby South</strong><br>Deprivation score: <strong>35.1%</strong> <strong>Derbyshire Dales</strong><br>Deprivation score: <strong>11.5%</strong> <strong>Dewsbury and Batley</strong><br>Deprivation score: <strong>32.9%</strong> <strong>Didcot and Wantage</strong><br>Deprivation score: <strong>9.7%</strong> <strong>Doncaster Central</strong><br>Deprivation score: <strong>30.3%</strong> <strong>Doncaster East and the Isle of Axholme</strong><br>Deprivation score: <strong>22.1%</strong> <strong>Doncaster North</strong><br>Deprivation score: <strong>31.4%</strong> <strong>Dorking and Horley</strong><br>Deprivation score: <strong>10.8%</strong> <strong>Dover and Deal</strong><br>Deprivation score: <strong>23.1%</strong> <strong>Droitwich and Evesham</strong><br>Deprivation score: <strong>16.2%</strong> <strong>Dudley</strong><br>Deprivation score: <strong>32.3%</strong> <strong>Dulwich and West Norwood</strong><br>Deprivation score: <strong>24.1%</strong> <strong>Dumfries and Galloway</strong><br>Deprivation score: <strong>19.7%</strong> <strong>Dumfriesshire, Clydesdale and Tweeddale</strong><br>Deprivation score: <strong>16.4%</strong> <strong>Dundee Central</strong><br>Deprivation score: <strong>29.5%</strong> <strong>Dunfermline and Dollar</strong><br>Deprivation score: <strong>15.8%</strong> <strong>Dunstable and Leighton Buzzard</strong><br>Deprivation score: <strong>16.1%</strong> <strong>Dwyfor Meirionnydd</strong><br>Deprivation score: <strong>18.2%</strong> <strong>Ealing Central and Acton</strong><br>Deprivation score: <strong>21.9%</strong> <strong>Ealing North</strong><br>Deprivation score: <strong>23.4%</strong> <strong>Ealing Southall</strong><br>Deprivation score: <strong>24.4%</strong> <strong>Earley and Woodley</strong><br>Deprivation score: <strong>11.2%</strong> <strong>Easington</strong><br>Deprivation score: <strong>35.9%</strong> <strong>East Antrim</strong><br>Deprivation score: <strong>35.9%</strong> <strong>East Grinstead and Uckfield</strong><br>Deprivation score: <strong>9.1%</strong> <strong>East Ham</strong><br>Deprivation score: <strong>28.9%</strong> <strong>East Hampshire</strong><br>Deprivation score: <strong>10.1%</strong> <strong>East Kilbride and Strathaven</strong><br>Deprivation score: <strong>15.6%</strong> <strong>East Londonderry</strong><br>Deprivation score: <strong>47.4%</strong> <strong>East Renfrewshire</strong><br>Deprivation score: <strong>10.0%</strong> <strong>East Surrey</strong><br>Deprivation score: <strong>12.8%</strong> <strong>East Thanet</strong><br>Deprivation score: <strong>34.2%</strong> <strong>East Wiltshire</strong><br>Deprivation score: <strong>11.9%</strong> <strong>East Worthing and Shoreham</strong><br>Deprivation score: <strong>16.4%</strong> <strong>Eastbourne</strong><br>Deprivation score: <strong>22.1%</strong> <strong>Eastleigh</strong><br>Deprivation score: <strong>9.7%</strong> <strong>Edinburgh East and Musselburgh</strong><br>Deprivation score: <strong>19.1%</strong> <strong>Edinburgh North and Leith</strong><br>Deprivation score: <strong>15.9%</strong> <strong>Edinburgh South</strong><br>Deprivation score: <strong>11.6%</strong> <strong>Edinburgh South West</strong><br>Deprivation score: <strong>14.8%</strong> <strong>Edinburgh West</strong><br>Deprivation score: <strong>10.6%</strong> <strong>Edmonton and Winchmore Hill</strong><br>Deprivation score: <strong>27.9%</strong> <strong>Ellesmere Port and Bromborough</strong><br>Deprivation score: <strong>25.6%</strong> <strong>Eltham and Chislehurst</strong><br>Deprivation score: <strong>21.7%</strong> <strong>Ely and East Cambridgeshire</strong><br>Deprivation score: <strong>11.2%</strong> <strong>Enfield North</strong><br>Deprivation score: <strong>27.3%</strong> <strong>Epping Forest</strong><br>Deprivation score: <strong>14.9%</strong> <strong>Epsom and Ewell</strong><br>Deprivation score: <strong>8.7%</strong> <strong>Erewash</strong><br>Deprivation score: <strong>20.7%</strong> <strong>Erith and Thamesmead</strong><br>Deprivation score: <strong>25.2%</strong> <strong>Esher and Walton</strong><br>Deprivation score: <strong>8.0%</strong> <strong>Exeter</strong><br>Deprivation score: <strong>16.7%</strong> <strong>Exmouth and Exeter East</strong><br>Deprivation score: <strong>13.4%</strong> <strong>Falkirk</strong><br>Deprivation score: <strong>20.5%</strong> <strong>Fareham and Waterlooville</strong><br>Deprivation score: <strong>12.8%</strong> <strong>Farnham and Bordon</strong><br>Deprivation score: <strong>8.7%</strong> <strong>Faversham and Mid Kent</strong><br>Deprivation score: <strong>19.5%</strong> <strong>Feltham and Heston</strong><br>Deprivation score: <strong>23.7%</strong> <strong>Fermanagh and South Tyrone</strong><br>Deprivation score: <strong>45.1%</strong> <strong>Filton and Bradley Stoke</strong><br>Deprivation score: <strong>10.1%</strong> <strong>Finchley and Golders Green</strong><br>Deprivation score: <strong>15.0%</strong> <strong>Folkestone and Hythe</strong><br>Deprivation score: <strong>25.7%</strong> <strong>Forest of Dean</strong><br>Deprivation score: <strong>17.8%</strong> <strong>Foyle</strong><br>Deprivation score: <strong>63.7%</strong> <strong>Frome and East Somerset</strong><br>Deprivation score: <strong>14.7%</strong> <strong>Fylde</strong><br>Deprivation score: <strong>15.1%</strong> <strong>Gainsborough</strong><br>Deprivation score: <strong>20.5%</strong> <strong>Gateshead Central and Whickham</strong><br>Deprivation score: <strong>30.5%</strong> <strong>Gedling</strong><br>Deprivation score: <strong>15.4%</strong> <strong>Gillingham and Rainham</strong><br>Deprivation score: <strong>23.0%</strong> <strong>Glasgow East</strong><br>Deprivation score: <strong>35.5%</strong> <strong>Glasgow North</strong><br>Deprivation score: <strong>27.6%</strong> <strong>Glasgow North East</strong><br>Deprivation score: <strong>40.6%</strong> <strong>Glasgow South</strong><br>Deprivation score: <strong>26.6%</strong> <strong>Glasgow South West</strong><br>Deprivation score: <strong>31.9%</strong> <strong>Glasgow West</strong><br>Deprivation score: <strong>26.0%</strong> <strong>Glastonbury and Somerton</strong><br>Deprivation score: <strong>16.1%</strong> <strong>Glenrothes and Mid Fife</strong><br>Deprivation score: <strong>27.5%</strong> <strong>Gloucester</strong><br>Deprivation score: <strong>23.7%</strong> <strong>Godalming and Ash</strong><br>Deprivation score: <strong>9.2%</strong> <strong>Goole and Pocklington</strong><br>Deprivation score: <strong>11.7%</strong> <strong>Gordon and Buchan</strong><br>Deprivation score: <strong>10.6%</strong> <strong>Gorton and Denton</strong><br>Deprivation score: <strong>39.6%</strong> <strong>Gosport</strong><br>Deprivation score: <strong>18.6%</strong> <strong>Gower</strong><br>Deprivation score: <strong>16.2%</strong> <strong>Grantham and Bourne</strong><br>Deprivation score: <strong>15.2%</strong> <strong>Gravesham</strong><br>Deprivation score: <strong>21.8%</strong> <strong>Great Grimsby and Cleethorpes</strong><br>Deprivation score: <strong>38.6%</strong> <strong>Great Yarmouth</strong><br>Deprivation score: <strong>33.3%</strong> <strong>Greenwich and Woolwich</strong><br>Deprivation score: <strong>23.9%</strong> <strong>Guildford</strong><br>Deprivation score: <strong>8.9%</strong> <strong>Hackney North and Stoke Newington</strong><br>Deprivation score: <strong>30.9%</strong> <strong>Hackney South and Shoreditch</strong><br>Deprivation score: <strong>34.0%</strong> <strong>Halesowen</strong><br>Deprivation score: <strong>24.9%</strong> <strong>Halifax</strong><br>Deprivation score: <strong>31.7%</strong> <strong>Hamble Valley</strong><br>Deprivation score: <strong>8.6%</strong> <strong>Hamilton and Clyde Valley</strong><br>Deprivation score: <strong>24.0%</strong> <strong>Hammersmith and Chiswick</strong><br>Deprivation score: <strong>21.9%</strong> <strong>Hampstead and Highgate</strong><br>Deprivation score: <strong>15.6%</strong> <strong>Harborough, Oadby and Wigston</strong><br>Deprivation score: <strong>11.1%</strong> <strong>Harlow</strong><br>Deprivation score: <strong>19.0%</strong> <strong>Harpenden and Berkhamsted</strong><br>Deprivation score: <strong>6.6%</strong> <strong>Harrogate and Knaresborough</strong><br>Deprivation score: <strong>10.5%</strong> <strong>Harrow East</strong><br>Deprivation score: <strong>16.3%</strong> <strong>Harrow West</strong><br>Deprivation score: <strong>16.4%</strong> <strong>Hartlepool</strong><br>Deprivation score: <strong>34.6%</strong> <strong>Harwich and North Essex</strong><br>Deprivation score: <strong>18.1%</strong> <strong>Hastings and Rye</strong><br>Deprivation score: <strong>33.0%</strong> <strong>Havant</strong><br>Deprivation score: <strong>23.9%</strong> <strong>Hayes and Harlington</strong><br>Deprivation score: <strong>24.5%</strong> <strong>Hazel Grove</strong><br>Deprivation score: <strong>21.8%</strong> <strong>Hemel Hempstead</strong><br>Deprivation score: <strong>16.1%</strong> <strong>Hendon</strong><br>Deprivation score: <strong>19.3%</strong> <strong>Henley and Thame</strong><br>Deprivation score: <strong>8.7%</strong> <strong>Hereford and South Herefordshire</strong><br>Deprivation score: <strong>19.3%</strong> <strong>Herne Bay and Sandwich</strong><br>Deprivation score: <strong>20.3%</strong> <strong>Hertford and Stortford</strong><br>Deprivation score: <strong>7.8%</strong> <strong>Hertsmere</strong><br>Deprivation score: <strong>13.6%</strong> <strong>Hexham</strong><br>Deprivation score: <strong>16.5%</strong> <strong>Heywood and Middleton North</strong><br>Deprivation score: <strong>33.1%</strong> <strong>High Peak</strong><br>Deprivation score: <strong>15.6%</strong> <strong>Hinckley and Bosworth</strong><br>Deprivation score: <strong>14.3%</strong> <strong>Hitchin</strong><br>Deprivation score: <strong>9.3%</strong> <strong>Holborn and St Pancras</strong><br>Deprivation score: <strong>23.8%</strong> <strong>Honiton and Sidmouth</strong><br>Deprivation score: <strong>12.7%</strong> <strong>Hornchurch and Upminster</strong><br>Deprivation score: <strong>16.9%</strong> <strong>Hornsey and Friern Barnet</strong><br>Deprivation score: <strong>18.8%</strong> <strong>Horsham</strong><br>Deprivation score: <strong>9.9%</strong> <strong>Houghton and Sunderland South</strong><br>Deprivation score: <strong>30.6%</strong> <strong>Hove and Portslade</strong><br>Deprivation score: <strong>18.0%</strong> <strong>Huddersfield</strong><br>Deprivation score: <strong>30.1%</strong> <strong>Huntingdon</strong><br>Deprivation score: <strong>12.0%</strong> <strong>Hyndburn</strong><br>Deprivation score: <strong>33.6%</strong> <strong>Ilford North</strong><br>Deprivation score: <strong>17.0%</strong> <strong>Ilford South</strong><br>Deprivation score: <strong>22.0%</strong> <strong>Inverclyde and Renfrewshire West</strong><br>Deprivation score: <strong>26.2%</strong> <strong>Inverness, Skye and West Ross-shire</strong><br>Deprivation score: <strong>17.8%</strong> <strong>Ipswich</strong><br>Deprivation score: <strong>26.5%</strong> <strong>Isle of Wight East</strong><br>Deprivation score: <strong>24.3%</strong> <strong>Isle of Wight West</strong><br>Deprivation score: <strong>22.2%</strong> <strong>Islington North</strong><br>Deprivation score: <strong>28.3%</strong> <strong>Islington South and Finsbury</strong><br>Deprivation score: <strong>26.9%</strong> <strong>Jarrow and Gateshead East</strong><br>Deprivation score: <strong>34.6%</strong> <strong>Keighley and Ilkley</strong><br>Deprivation score: <strong>25.7%</strong> <strong>Kenilworth and Southam</strong><br>Deprivation score: <strong>9.8%</strong> <strong>Kensington and Bayswater</strong><br>Deprivation score: <strong>20.7%</strong> <strong>Kettering</strong><br>Deprivation score: <strong>18.8%</strong> <strong>Kilmarnock and Loudoun</strong><br>Deprivation score: <strong>24.4%</strong> <strong>Kingston and Surbiton</strong><br>Deprivation score: <strong>12.5%</strong> <strong>Kingston upon Hull East</strong><br>Deprivation score: <strong>39.9%</strong> <strong>Kingston upon Hull North and Cottingham</strong><br>Deprivation score: <strong>35.2%</strong> <strong>Kingston upon Hull West and Haltemprice</strong><br>Deprivation score: <strong>31.5%</strong> <strong>Kingswinford and South Staffordshire</strong><br>Deprivation score: <strong>11.6%</strong> <strong>Knowsley</strong><br>Deprivation score: <strong>48.0%</strong> <strong>Lagan Valley</strong><br>Deprivation score: <strong>31.1%</strong> <strong>Lancaster and Wyre</strong><br>Deprivation score: <strong>18.9%</strong> <strong>Leeds Central and Headingley</strong><br>Deprivation score: <strong>25.6%</strong> <strong>Leeds East</strong><br>Deprivation score: <strong>37.1%</strong> <strong>Leeds North East</strong><br>Deprivation score: <strong>22.5%</strong> <strong>Leeds North West</strong><br>Deprivation score: <strong>13.4%</strong> <strong>Leeds South</strong><br>Deprivation score: <strong>44.1%</strong> <strong>Leeds South West and Morley</strong><br>Deprivation score: <strong>25.1%</strong> <strong>Leeds West and Pudsey</strong><br>Deprivation score: <strong>32.4%</strong> <strong>Leicester East</strong><br>Deprivation score: <strong>27.6%</strong> <strong>Leicester South</strong><br>Deprivation score: <strong>28.9%</strong> <strong>Leicester West</strong><br>Deprivation score: <strong>35.2%</strong> <strong>Leigh and Atherton</strong><br>Deprivation score: <strong>28.2%</strong> <strong>Lewes</strong><br>Deprivation score: <strong>14.4%</strong> <strong>Lewisham East</strong><br>Deprivation score: <strong>29.2%</strong> <strong>Lewisham North</strong><br>Deprivation score: <strong>26.7%</strong> <strong>Lewisham West and East Dulwich</strong><br>Deprivation score: <strong>20.8%</strong> <strong>Leyton and Wanstead</strong><br>Deprivation score: <strong>21.5%</strong> <strong>Lichfield</strong><br>Deprivation score: <strong>12.1%</strong> <strong>Lincoln</strong><br>Deprivation score: <strong>24.2%</strong> <strong>Liverpool Garston</strong><br>Deprivation score: <strong>31.2%</strong> <strong>Liverpool Riverside</strong><br>Deprivation score: <strong>49.3%</strong> <strong>Liverpool Walton</strong><br>Deprivation score: <strong>47.4%</strong> <strong>Liverpool Wavertree</strong><br>Deprivation score: <strong>34.3%</strong> <strong>Liverpool West Derby</strong><br>Deprivation score: <strong>45.3%</strong> <strong>Livingston</strong><br>Deprivation score: <strong>19.1%</strong> <strong>Llanelli</strong><br>Deprivation score: <strong>24.5%</strong> <strong>Lothian East</strong><br>Deprivation score: <strong>15.6%</strong> <strong>Loughborough</strong><br>Deprivation score: <strong>14.7%</strong> <strong>Louth and Horncastle</strong><br>Deprivation score: <strong>25.2%</strong> <strong>Lowestoft</strong><br>Deprivation score: <strong>27.5%</strong> <strong>Luton North</strong><br>Deprivation score: <strong>23.1%</strong> <strong>Luton South and South Bedfordshire</strong><br>Deprivation score: <strong>27.4%</strong> <strong>Macclesfield</strong><br>Deprivation score: <strong>13.0%</strong> <strong>Maidenhead</strong><br>Deprivation score: <strong>8.0%</strong> <strong>Maidstone and Malling</strong><br>Deprivation score: <strong>15.3%</strong> <strong>Makerfield</strong><br>Deprivation score: <strong>24.2%</strong> <strong>Maldon</strong><br>Deprivation score: <strong>13.5%</strong> <strong>Manchester Central</strong><br>Deprivation score: <strong>40.5%</strong> <strong>Manchester Rusholme</strong><br>Deprivation score: <strong>37.5%</strong> <strong>Manchester Withington</strong><br>Deprivation score: <strong>24.9%</strong> <strong>Mansfield</strong><br>Deprivation score: <strong>28.5%</strong> <strong>Melksham and Devizes</strong><br>Deprivation score: <strong>13.2%</strong> <strong>Melton and Syston</strong><br>Deprivation score: <strong>12.9%</strong> <strong>Meriden and Solihull East</strong><br>Deprivation score: <strong>19.9%</strong> <strong>Merthyr Tydfil and Aberdare</strong><br>Deprivation score: <strong>29.9%</strong> <strong>Mid Bedfordshire</strong><br>Deprivation score: <strong>9.6%</strong> <strong>Mid Buckinghamshire</strong><br>Deprivation score: <strong>7.6%</strong> <strong>Mid Cheshire</strong><br>Deprivation score: <strong>19.7%</strong> <strong>Mid Derbyshire</strong><br>Deprivation score: <strong>10.4%</strong> <strong>Mid Dorset and North Poole</strong><br>Deprivation score: <strong>12.4%</strong> <strong>Mid Dunbartonshire</strong><br>Deprivation score: <strong>9.8%</strong> <strong>Mid Leicestershire</strong><br>Deprivation score: <strong>10.4%</strong> <strong>Mid Norfolk</strong><br>Deprivation score: <strong>18.1%</strong> <strong>Mid Sussex</strong><br>Deprivation score: <strong>7.9%</strong> <strong>Mid Ulster</strong><br>Deprivation score: <strong>41.1%</strong> <strong>Mid and South Pembrokeshire</strong><br>Deprivation score: <strong>21.6%</strong> <strong>Middlesbrough South and East Cleveland</strong><br>Deprivation score: <strong>27.6%</strong> <strong>Middlesbrough and Thornaby East</strong><br>Deprivation score: <strong>44.6%</strong> <strong>Midlothian</strong><br>Deprivation score: <strong>18.7%</strong> <strong>Milton Keynes Central</strong><br>Deprivation score: <strong>17.7%</strong> <strong>Milton Keynes North</strong><br>Deprivation score: <strong>15.8%</strong> <strong>Mitcham and Morden</strong><br>Deprivation score: <strong>19.0%</strong> <strong>Monmouthshire</strong><br>Deprivation score: <strong>15.2%</strong> <strong>Montgomeryshire and Glyndŵr</strong><br>Deprivation score: <strong>19.7%</strong> <strong>Moray West, Nairn and Strathspey</strong><br>Deprivation score: <strong>13.9%</strong> <strong>Morecambe and Lunesdale</strong><br>Deprivation score: <strong>22.6%</strong> <strong>Motherwell, Wishaw and Carluke</strong><br>Deprivation score: <strong>26.0%</strong> <strong>Na h-Eileanan an Iar</strong><br>Deprivation score: <strong>17.2%</strong> <strong>Neath and Swansea East</strong><br>Deprivation score: <strong>24.7%</strong> <strong>New Forest East</strong><br>Deprivation score: <strong>13.7%</strong> <strong>New Forest West</strong><br>Deprivation score: <strong>12.3%</strong> <strong>Newark</strong><br>Deprivation score: <strong>15.8%</strong> <strong>Newbury</strong><br>Deprivation score: <strong>10.7%</strong> <strong>Newcastle upon Tyne Central and West</strong><br>Deprivation score: <strong>35.0%</strong> <strong>Newcastle upon Tyne East and Wallsend</strong><br>Deprivation score: <strong>32.4%</strong> <strong>Newcastle upon Tyne North</strong><br>Deprivation score: <strong>16.5%</strong> <strong>Newcastle-under-Lyme</strong><br>Deprivation score: <strong>19.3%</strong> <strong>Newport East</strong><br>Deprivation score: <strong>31.0%</strong> <strong>Newport West and Islwyn</strong><br>Deprivation score: <strong>20.7%</strong> <strong>Newry and Armagh</strong><br>Deprivation score: <strong>50.7%</strong> <strong>Newton Abbot</strong><br>Deprivation score: <strong>16.9%</strong> <strong>Newton Aycliffe and Spennymoor</strong><br>Deprivation score: <strong>26.7%</strong> <strong>Normanton and Hemsworth</strong><br>Deprivation score: <strong>29.0%</strong> <strong>North Antrim</strong><br>Deprivation score: <strong>40.4%</strong> <strong>North Ayrshire and Arran</strong><br>Deprivation score: <strong>24.9%</strong> <strong>North Bedfordshire</strong><br>Deprivation score: <strong>12.5%</strong> <strong>North Cornwall</strong><br>Deprivation score: <strong>23.5%</strong> <strong>North Cotswolds</strong><br>Deprivation score: <strong>11.3%</strong> <strong>North Devon</strong><br>Deprivation score: <strong>20.4%</strong> <strong>North Dorset</strong><br>Deprivation score: <strong>13.8%</strong> <strong>North Down</strong><br>Deprivation score: <strong>31.9%</strong> <strong>North Durham</strong><br>Deprivation score: <strong>25.4%</strong> <strong>North East Cambridgeshire</strong><br>Deprivation score: <strong>25.6%</strong> <strong>North East Derbyshire</strong><br>Deprivation score: <strong>17.9%</strong> <strong>North East Fife</strong><br>Deprivation score: <strong>14.1%</strong> <strong>North East Hampshire</strong><br>Deprivation score: <strong>6.1%</strong> <strong>North East Hertfordshire</strong><br>Deprivation score: <strong>12.0%</strong> <strong>North East Somerset and Hanham</strong><br>Deprivation score: <strong>11.6%</strong> <strong>North Herefordshire</strong><br>Deprivation score: <strong>18.1%</strong> <strong>North Norfolk</strong><br>Deprivation score: <strong>21.0%</strong> <strong>North Northumberland</strong><br>Deprivation score: <strong>19.0%</strong> <strong>North Shropshire</strong><br>Deprivation score: <strong>18.1%</strong> <strong>North Somerset</strong><br>Deprivation score: <strong>8.6%</strong> <strong>North Warwickshire and Bedworth</strong><br>Deprivation score: <strong>20.0%</strong> <strong>North West Cambridgeshire</strong><br>Deprivation score: <strong>19.4%</strong> <strong>North West Essex</strong><br>Deprivation score: <strong>10.2%</strong> <strong>North West Hampshire</strong><br>Deprivation score: <strong>12.8%</strong> <strong>North West Leicestershire</strong><br>Deprivation score: <strong>14.5%</strong> <strong>North West Norfolk</strong><br>Deprivation score: <strong>25.0%</strong> <strong>Northampton North</strong><br>Deprivation score: <strong>28.2%</strong> <strong>Northampton South</strong><br>Deprivation score: <strong>19.6%</strong> <strong>Norwich North</strong><br>Deprivation score: <strong>21.1%</strong> <strong>Norwich South</strong><br>Deprivation score: <strong>24.7%</strong> <strong>Nottingham East</strong><br>Deprivation score: <strong>34.6%</strong> <strong>Nottingham North and Kimberley</strong><br>Deprivation score: <strong>37.3%</strong> <strong>Nottingham South</strong><br>Deprivation score: <strong>29.5%</strong> <strong>Nuneaton</strong><br>Deprivation score: <strong>24.0%</strong> <strong>Old Bexley and Sidcup</strong><br>Deprivation score: <strong>11.9%</strong> <strong>Oldham East and Saddleworth</strong><br>Deprivation score: <strong>33.0%</strong> <strong>Oldham West, Chadderton and Royton</strong><br>Deprivation score: <strong>37.2%</strong> <strong>Orkney and Shetland</strong><br>Deprivation score: <strong>13.6%</strong> <strong>Orpington</strong><br>Deprivation score: <strong>16.1%</strong> <strong>Ossett and Denby Dale</strong><br>Deprivation score: <strong>16.1%</strong> <strong>Oxford East</strong><br>Deprivation score: <strong>18.1%</strong> <strong>Oxford West and Abingdon</strong><br>Deprivation score: <strong>9.8%</strong> <strong>Paisley and Renfrewshire North</strong><br>Deprivation score: <strong>23.7%</strong> <strong>Paisley and Renfrewshire South</strong><br>Deprivation score: <strong>24.5%</strong> <strong>Peckham</strong><br>Deprivation score: <strong>31.0%</strong> <strong>Pendle and Clitheroe</strong><br>Deprivation score: <strong>25.3%</strong> <strong>Penistone and Stocksbridge</strong><br>Deprivation score: <strong>18.8%</strong> <strong>Penrith and Solway</strong><br>Deprivation score: <strong>18.0%</strong> <strong>Perth and Kinross-shire</strong><br>Deprivation score: <strong>14.3%</strong> <strong>Peterborough</strong><br>Deprivation score: <strong>31.6%</strong> <strong>Plymouth Moor View</strong><br>Deprivation score: <strong>29.0%</strong> <strong>Plymouth Sutton and Devonport</strong><br>Deprivation score: <strong>31.8%</strong> <strong>Pontefract, Castleford and Knottingley</strong><br>Deprivation score: <strong>30.6%</strong> <strong>Pontypridd</strong><br>Deprivation score: <strong>23.3%</strong> <strong>Poole</strong><br>Deprivation score: <strong>16.1%</strong> <strong>Poplar and Limehouse</strong><br>Deprivation score: <strong>24.5%</strong> <strong>Portsmouth North</strong><br>Deprivation score: <strong>25.0%</strong> <strong>Portsmouth South</strong><br>Deprivation score: <strong>29.2%</strong> <strong>Preston</strong><br>Deprivation score: <strong>33.3%</strong> <strong>Putney</strong><br>Deprivation score: <strong>15.9%</strong> <strong>Queen's Park and Maida Vale</strong><br>Deprivation score: <strong>29.5%</strong> <strong>Rawmarsh and Conisbrough</strong><br>Deprivation score: <strong>31.4%</strong> <strong>Rayleigh and Wickford</strong><br>Deprivation score: <strong>9.7%</strong> <strong>Reading Central</strong><br>Deprivation score: <strong>17.5%</strong> <strong>Reading West and Mid Berkshire</strong><br>Deprivation score: <strong>12.8%</strong> <strong>Redcar</strong><br>Deprivation score: <strong>31.9%</strong> <strong>Redditch</strong><br>Deprivation score: <strong>21.7%</strong> <strong>Reigate</strong><br>Deprivation score: <strong>10.4%</strong> <strong>Rhondda and Ogmore</strong><br>Deprivation score: <strong>32.5%</strong> <strong>Ribble Valley</strong><br>Deprivation score: <strong>12.4%</strong> <strong>Richmond Park</strong><br>Deprivation score: <strong>9.6%</strong> <strong>Richmond and Northallerton</strong><br>Deprivation score: <strong>12.3%</strong> <strong>Rochdale</strong><br>Deprivation score: <strong>38.6%</strong> <strong>Rochester and Strood</strong><br>Deprivation score: <strong>22.3%</strong> <strong>Romford</strong><br>Deprivation score: <strong>16.0%</strong> <strong>Romsey and Southampton North</strong><br>Deprivation score: <strong>13.0%</strong> <strong>Rossendale and Darwen</strong><br>Deprivation score: <strong>26.0%</strong> <strong>Rother Valley</strong><br>Deprivation score: <strong>23.7%</strong> <strong>Rotherham</strong><br>Deprivation score: <strong>35.0%</strong> <strong>Rugby</strong><br>Deprivation score: <strong>14.4%</strong> <strong>Ruislip, Northwood and Pinner</strong><br>Deprivation score: <strong>10.7%</strong> <strong>Runcorn and Helsby</strong><br>Deprivation score: <strong>27.2%</strong> <strong>Runnymede and Weybridge</strong><br>Deprivation score: <strong>10.8%</strong> <strong>Rushcliffe</strong><br>Deprivation score: <strong>7.2%</strong> <strong>Rutherglen</strong><br>Deprivation score: <strong>23.5%</strong> <strong>Rutland and Stamford</strong><br>Deprivation score: <strong>10.0%</strong> <strong>Salford</strong><br>Deprivation score: <strong>37.4%</strong> <strong>Salisbury</strong><br>Deprivation score: <strong>14.0%</strong> <strong>Scarborough and Whitby</strong><br>Deprivation score: <strong>26.6%</strong> <strong>Scunthorpe</strong><br>Deprivation score: <strong>25.8%</strong> <strong>Sefton Central</strong><br>Deprivation score: <strong>14.5%</strong> <strong>Selby</strong><br>Deprivation score: <strong>14.0%</strong> <strong>Sevenoaks</strong><br>Deprivation score: <strong>12.7%</strong> <strong>Sheffield Brightside and Hillsborough</strong><br>Deprivation score: <strong>42.6%</strong> <strong>Sheffield Central</strong><br>Deprivation score: <strong>20.3%</strong> <strong>Sheffield Hallam</strong><br>Deprivation score: <strong>8.6%</strong> <strong>Sheffield Heeley</strong><br>Deprivation score: <strong>34.2%</strong> <strong>Sheffield South East</strong><br>Deprivation score: <strong>32.1%</strong> <strong>Sherwood Forest</strong><br>Deprivation score: <strong>20.2%</strong> <strong>Shipley</strong><br>Deprivation score: <strong>19.3%</strong> <strong>Shrewsbury</strong><br>Deprivation score: <strong>16.1%</strong> <strong>Sittingbourne and Sheppey</strong><br>Deprivation score: <strong>29.7%</strong> <strong>Skipton and Ripon</strong><br>Deprivation score: <strong>12.4%</strong> <strong>Sleaford and North Hykeham</strong><br>Deprivation score: <strong>11.9%</strong> <strong>Slough</strong><br>Deprivation score: <strong>22.6%</strong> <strong>Smethwick</strong><br>Deprivation score: <strong>34.2%</strong> <strong>Solihull West and Shirley</strong><br>Deprivation score: <strong>11.2%</strong> <strong>South Antrim</strong><br>Deprivation score: <strong>33.7%</strong> <strong>South Basildon and East Thurrock</strong><br>Deprivation score: <strong>22.8%</strong> <strong>South Cambridgeshire</strong><br>Deprivation score: <strong>9.1%</strong> <strong>South Cotswolds</strong><br>Deprivation score: <strong>10.1%</strong> <strong>South Derbyshire</strong><br>Deprivation score: <strong>14.9%</strong> <strong>South Devon</strong><br>Deprivation score: <strong>18.9%</strong> <strong>South Dorset</strong><br>Deprivation score: <strong>21.9%</strong> <strong>South Down</strong><br>Deprivation score: <strong>45.0%</strong> <strong>South East Cornwall</strong><br>Deprivation score: <strong>21.6%</strong> <strong>South Holland and The Deepings</strong><br>Deprivation score: <strong>16.7%</strong> <strong>South Leicestershire</strong><br>Deprivation score: <strong>9.1%</strong> <strong>South Norfolk</strong><br>Deprivation score: <strong>12.0%</strong> <strong>South Northamptonshire</strong><br>Deprivation score: <strong>7.6%</strong> <strong>South Ribble</strong><br>Deprivation score: <strong>14.3%</strong> <strong>South Shields</strong><br>Deprivation score: <strong>31.2%</strong> <strong>South Shropshire</strong><br>Deprivation score: <strong>17.8%</strong> <strong>South Suffolk</strong><br>Deprivation score: <strong>14.2%</strong> <strong>South West Devon</strong><br>Deprivation score: <strong>11.5%</strong> <strong>South West Hertfordshire</strong><br>Deprivation score: <strong>9.9%</strong> <strong>South West Norfolk</strong><br>Deprivation score: <strong>22.2%</strong> <strong>South West Wiltshire</strong><br>Deprivation score: <strong>15.9%</strong> <strong>Southampton Itchen</strong><br>Deprivation score: <strong>27.3%</strong> <strong>Southampton Test</strong><br>Deprivation score: <strong>27.9%</strong> <strong>Southend East and Rochford</strong><br>Deprivation score: <strong>27.9%</strong> <strong>Southend West and Leigh</strong><br>Deprivation score: <strong>16.9%</strong> <strong>Southgate and Wood Green</strong><br>Deprivation score: <strong>22.9%</strong> <strong>Southport</strong><br>Deprivation score: <strong>20.9%</strong> <strong>Spelthorne</strong><br>Deprivation score: <strong>15.0%</strong> <strong>Spen Valley</strong><br>Deprivation score: <strong>22.1%</strong> <strong>St Albans</strong><br>Deprivation score: <strong>9.5%</strong> <strong>St Austell and Newquay</strong><br>Deprivation score: <strong>24.3%</strong> <strong>St Helens North</strong><br>Deprivation score: <strong>32.1%</strong> <strong>St Helens South and Whiston</strong><br>Deprivation score: <strong>33.9%</strong> <strong>St Ives</strong><br>Deprivation score: <strong>24.2%</strong> <strong>St Neots and Mid Cambridgeshire</strong><br>Deprivation score: <strong>9.7%</strong> <strong>Stafford</strong><br>Deprivation score: <strong>15.0%</strong> <strong>Staffordshire Moorlands</strong><br>Deprivation score: <strong>15.7%</strong> <strong>Stalybridge and Hyde</strong><br>Deprivation score: <strong>30.2%</strong> <strong>Stevenage</strong><br>Deprivation score: <strong>18.5%</strong> <strong>Stirling and Strathallan</strong><br>Deprivation score: <strong>14.9%</strong> <strong>Stockport</strong><br>Deprivation score: <strong>31.0%</strong> <strong>Stockton North</strong><br>Deprivation score: <strong>34.2%</strong> <strong>Stockton West</strong><br>Deprivation score: <strong>12.9%</strong> <strong>Stoke-on-Trent Central</strong><br>Deprivation score: <strong>37.3%</strong> <strong>Stoke-on-Trent North</strong><br>Deprivation score: <strong>32.5%</strong> <strong>Stoke-on-Trent South</strong><br>Deprivation score: <strong>24.6%</strong> <strong>Stone, Great Wyrley and Penkridge</strong><br>Deprivation score: <strong>13.6%</strong> <strong>Stourbridge</strong><br>Deprivation score: <strong>25.7%</strong> <strong>Strangford</strong><br>Deprivation score: <strong>39.5%</strong> <strong>Stratford and Bow</strong><br>Deprivation score: <strong>28.8%</strong> <strong>Stratford-on-Avon</strong><br>Deprivation score: <strong>11.9%</strong> <strong>Streatham and Croydon North</strong><br>Deprivation score: <strong>22.8%</strong> <strong>Stretford and Urmston</strong><br>Deprivation score: <strong>22.9%</strong> <strong>Stroud</strong><br>Deprivation score: <strong>11.1%</strong> <strong>Suffolk Coastal</strong><br>Deprivation score: <strong>15.9%</strong> <strong>Sunderland Central</strong><br>Deprivation score: <strong>31.4%</strong> <strong>Surrey Heath</strong><br>Deprivation score: <strong>8.3%</strong> <strong>Sussex Weald</strong><br>Deprivation score: <strong>12.6%</strong> <strong>Sutton Coldfield</strong><br>Deprivation score: <strong>16.0%</strong> <strong>Sutton and Cheam</strong><br>Deprivation score: <strong>11.0%</strong> <strong>Swansea West</strong><br>Deprivation score: <strong>29.9%</strong> <strong>Swindon North</strong><br>Deprivation score: <strong>18.3%</strong> <strong>Swindon South</strong><br>Deprivation score: <strong>19.6%</strong> <strong>Tamworth</strong><br>Deprivation score: <strong>19.0%</strong> <strong>Tatton</strong><br>Deprivation score: <strong>10.4%</strong> <strong>Taunton and Wellington</strong><br>Deprivation score: <strong>18.1%</strong> <strong>Telford</strong><br>Deprivation score: <strong>29.3%</strong> <strong>Tewkesbury</strong><br>Deprivation score: <strong>12.7%</strong> <strong>The Wrekin</strong><br>Deprivation score: <strong>18.2%</strong> <strong>Thirsk and Malton</strong><br>Deprivation score: <strong>15.4%</strong> <strong>Thornbury and Yate</strong><br>Deprivation score: <strong>10.7%</strong> <strong>Thurrock</strong><br>Deprivation score: <strong>22.5%</strong> <strong>Tipton and Wednesbury</strong><br>Deprivation score: <strong>37.2%</strong> <strong>Tiverton and Minehead</strong><br>Deprivation score: <strong>19.4%</strong> <strong>Tonbridge</strong><br>Deprivation score: <strong>12.8%</strong> <strong>Tooting</strong><br>Deprivation score: <strong>16.7%</strong> <strong>Torbay</strong><br>Deprivation score: <strong>29.4%</strong> <strong>Torfaen</strong><br>Deprivation score: <strong>24.5%</strong> <strong>Torridge and Tavistock</strong><br>Deprivation score: <strong>21.8%</strong> <strong>Tottenham</strong><br>Deprivation score: <strong>35.1%</strong> <strong>Truro and Falmouth</strong><br>Deprivation score: <strong>18.0%</strong> <strong>Tunbridge Wells</strong><br>Deprivation score: <strong>11.1%</strong> <strong>Twickenham</strong><br>Deprivation score: <strong>9.2%</strong> <strong>Tynemouth</strong><br>Deprivation score: <strong>21.3%</strong> <strong>Upper Bann</strong><br>Deprivation score: <strong>43.2%</strong> <strong>Uxbridge and South Ruislip</strong><br>Deprivation score: <strong>15.6%</strong> <strong>Vale of Glamorgan</strong><br>Deprivation score: <strong>19.0%</strong> <strong>Vauxhall and Camberwell Green</strong><br>Deprivation score: <strong>27.3%</strong> <strong>Wakefield and Rothwell</strong><br>Deprivation score: <strong>26.3%</strong> <strong>Wallasey</strong><br>Deprivation score: <strong>34.6%</strong> <strong>Walsall and Bloxwich</strong><br>Deprivation score: <strong>40.1%</strong> <strong>Walthamstow</strong><br>Deprivation score: <strong>26.9%</strong> <strong>Warrington North</strong><br>Deprivation score: <strong>24.1%</strong> <strong>Warrington South</strong><br>Deprivation score: <strong>15.9%</strong> <strong>Warwick and Leamington</strong><br>Deprivation score: <strong>13.1%</strong> <strong>Washington and Gateshead South</strong><br>Deprivation score: <strong>30.2%</strong> <strong>Watford</strong><br>Deprivation score: <strong>15.3%</strong> <strong>Waveney Valley</strong><br>Deprivation score: <strong>17.2%</strong> <strong>Weald of Kent</strong><br>Deprivation score: <strong>15.8%</strong> <strong>Wellingborough and Rushden</strong><br>Deprivation score: <strong>20.7%</strong> <strong>Wells and Mendip Hills</strong><br>Deprivation score: <strong>13.4%</strong> <strong>Welwyn Hatfield</strong><br>Deprivation score: <strong>14.6%</strong> <strong>West Aberdeenshire and Kincardine</strong><br>Deprivation score: <strong>8.3%</strong> <strong>West Bromwich</strong><br>Deprivation score: <strong>33.6%</strong> <strong>West Dorset</strong><br>Deprivation score: <strong>15.9%</strong> <strong>West Dunbartonshire</strong><br>Deprivation score: <strong>29.1%</strong> <strong>West Ham and Beckton</strong><br>Deprivation score: <strong>30.5%</strong> <strong>West Lancashire</strong><br>Deprivation score: <strong>19.9%</strong> <strong>West Suffolk</strong><br>Deprivation score: <strong>17.3%</strong> <strong>West Tyrone</strong><br>Deprivation score: <strong>53.6%</strong> <strong>West Worcestershire</strong><br>Deprivation score: <strong>15.6%</strong> <strong>Westmorland and Lonsdale</strong><br>Deprivation score: <strong>13.8%</strong> <strong>Weston-super-Mare</strong><br>Deprivation score: <strong>24.7%</strong> <strong>Wetherby and Easingwold</strong><br>Deprivation score: <strong>10.7%</strong> <strong>Whitehaven and Workington</strong><br>Deprivation score: <strong>26.3%</strong> <strong>Widnes and Halewood</strong><br>Deprivation score: <strong>30.5%</strong> <strong>Wigan</strong><br>Deprivation score: <strong>27.8%</strong> <strong>Wimbledon</strong><br>Deprivation score: <strong>9.3%</strong> <strong>Winchester</strong><br>Deprivation score: <strong>9.2%</strong> <strong>Windsor</strong><br>Deprivation score: <strong>11.5%</strong> <strong>Wirral West</strong><br>Deprivation score: <strong>15.1%</strong> <strong>Witham</strong><br>Deprivation score: <strong>13.4%</strong> <strong>Witney</strong><br>Deprivation score: <strong>8.6%</strong> <strong>Woking</strong><br>Deprivation score: <strong>10.9%</strong> <strong>Wokingham</strong><br>Deprivation score: <strong>5.7%</strong> <strong>Wolverhampton North East</strong><br>Deprivation score: <strong>32.9%</strong> <strong>Wolverhampton South East</strong><br>Deprivation score: <strong>38.8%</strong> <strong>Wolverhampton West</strong><br>Deprivation score: <strong>27.1%</strong> <strong>Worcester</strong><br>Deprivation score: <strong>20.6%</strong> <strong>Worsley and Eccles</strong><br>Deprivation score: <strong>25.8%</strong> <strong>Worthing West</strong><br>Deprivation score: <strong>17.2%</strong> <strong>Wrexham</strong><br>Deprivation score: <strong>20.3%</strong> <strong>Wycombe</strong><br>Deprivation score: <strong>14.0%</strong> <strong>Wyre Forest</strong><br>Deprivation score: <strong>22.8%</strong> <strong>Wythenshawe and Sale East</strong><br>Deprivation score: <strong>34.3%</strong> <strong>Yeovil</strong><br>Deprivation score: <strong>18.8%</strong> <strong>Ynys Môn</strong><br>Deprivation score: <strong>19.8%</strong> <strong>York Central</strong><br>Deprivation score: <strong>15.3%</strong> <strong>York Outer</strong><br>Deprivation score: <strong>7.5%</strong> Go to the start of hex cartogram Proportions§
The proportion of constituency population living in a high deprivation lsoa (quintile 1), medium deprivation losa (quintile 2,3), or low deprivation losa (quintile 4,5).
Skip hex cartogram
Hexmap
<strong>Aberafan Maesteg</strong><br>Low deprivation: <strong>14.4%</strong><br>Medium deprivation: <strong>40.0%</strong><br>High deprivation: <strong>45.6%</strong> <strong>Aberdeen North</strong><br>Low deprivation: <strong>50.9%</strong><br>Medium deprivation: <strong>39.2%</strong><br>High deprivation: <strong>9.8%</strong> <strong>Aberdeen South</strong><br>Low deprivation: <strong>62.9%</strong><br>Medium deprivation: <strong>31.4%</strong><br>High deprivation: <strong>5.7%</strong> <strong>Aberdeenshire North and Moray East</strong><br>Low deprivation: <strong>44.0%</strong><br>Medium deprivation: <strong>49.8%</strong><br>High deprivation: <strong>6.2%</strong> <strong>Airdrie and Shotts</strong><br>Low deprivation: <strong>24.3%</strong><br>Medium deprivation: <strong>42.7%</strong><br>High deprivation: <strong>33.0%</strong> <strong>Aldershot</strong><br>Low deprivation: <strong>59.2%</strong><br>Medium deprivation: <strong>36.0%</strong><br>High deprivation: <strong>4.8%</strong> <strong>Aldridge-Brownhills</strong><br>Low deprivation: <strong>53.1%</strong><br>Medium deprivation: <strong>34.6%</strong><br>High deprivation: <strong>12.3%</strong> <strong>Alloa and Grangemouth</strong><br>Low deprivation: <strong>38.8%</strong><br>Medium deprivation: <strong>43.3%</strong><br>High deprivation: <strong>17.9%</strong> <strong>Altrincham and Sale West</strong><br>Low deprivation: <strong>83.7%</strong><br>Medium deprivation: <strong>11.2%</strong><br>High deprivation: <strong>5.1%</strong> <strong>Alyn and Deeside</strong><br>Low deprivation: <strong>54.0%</strong><br>Medium deprivation: <strong>35.5%</strong><br>High deprivation: <strong>10.6%</strong> <strong>Amber Valley</strong><br>Low deprivation: <strong>34.2%</strong><br>Medium deprivation: <strong>51.7%</strong><br>High deprivation: <strong>14.1%</strong> <strong>Angus and Perthshire Glens</strong><br>Low deprivation: <strong>55.0%</strong><br>Medium deprivation: <strong>42.5%</strong><br>High deprivation: <strong>2.5%</strong> <strong>Arbroath and Broughty Ferry</strong><br>Low deprivation: <strong>53.9%</strong><br>Medium deprivation: <strong>29.5%</strong><br>High deprivation: <strong>16.6%</strong> <strong>Argyll, Bute and South Lochaber</strong><br>Low deprivation: <strong>43.3%</strong><br>Medium deprivation: <strong>49.3%</strong><br>High deprivation: <strong>7.3%</strong> <strong>Arundel and South Downs</strong><br>Low deprivation: <strong>69.3%</strong><br>Medium deprivation: <strong>30.7%</strong><br>High deprivation: <strong>0%</strong> <strong>Ashfield</strong><br>Low deprivation: <strong>17.7%</strong><br>Medium deprivation: <strong>50.9%</strong><br>High deprivation: <strong>31.4%</strong> <strong>Ashford</strong><br>Low deprivation: <strong>47.3%</strong><br>Medium deprivation: <strong>39.7%</strong><br>High deprivation: <strong>13.0%</strong> <strong>Ashton-under-Lyne</strong><br>Low deprivation: <strong>5.6%</strong><br>Medium deprivation: <strong>49.4%</strong><br>High deprivation: <strong>45.0%</strong> <strong>Aylesbury</strong><br>Low deprivation: <strong>64.6%</strong><br>Medium deprivation: <strong>34.2%</strong><br>High deprivation: <strong>1.1%</strong> <strong>Ayr, Carrick and Cumnock</strong><br>Low deprivation: <strong>27.7%</strong><br>Medium deprivation: <strong>50.4%</strong><br>High deprivation: <strong>21.9%</strong> <strong>Banbury</strong><br>Low deprivation: <strong>63.2%</strong><br>Medium deprivation: <strong>28.7%</strong><br>High deprivation: <strong>8.0%</strong> <strong>Bangor Aberconwy</strong><br>Low deprivation: <strong>34.1%</strong><br>Medium deprivation: <strong>61.5%</strong><br>High deprivation: <strong>4.4%</strong> <strong>Barking</strong><br>Low deprivation: <strong>0%</strong><br>Medium deprivation: <strong>52.2%</strong><br>High deprivation: <strong>47.8%</strong> <strong>Barnsley North</strong><br>Low deprivation: <strong>13.0%</strong><br>Medium deprivation: <strong>49.9%</strong><br>High deprivation: <strong>37.1%</strong> <strong>Barnsley South</strong><br>Low deprivation: <strong>5.8%</strong><br>Medium deprivation: <strong>47.2%</strong><br>High deprivation: <strong>47.0%</strong> <strong>Barrow and Furness</strong><br>Low deprivation: <strong>29.5%</strong><br>Medium deprivation: <strong>41.6%</strong><br>High deprivation: <strong>28.9%</strong> <strong>Basildon and Billericay</strong><br>Low deprivation: <strong>28.9%</strong><br>Medium deprivation: <strong>49.3%</strong><br>High deprivation: <strong>21.8%</strong> <strong>Basingstoke</strong><br>Low deprivation: <strong>55.1%</strong><br>Medium deprivation: <strong>43.3%</strong><br>High deprivation: <strong>1.6%</strong> <strong>Bassetlaw</strong><br>Low deprivation: <strong>36.0%</strong><br>Medium deprivation: <strong>42.3%</strong><br>High deprivation: <strong>21.8%</strong> <strong>Bath</strong><br>Low deprivation: <strong>69.3%</strong><br>Medium deprivation: <strong>23.5%</strong><br>High deprivation: <strong>7.2%</strong> <strong>Bathgate and Linlithgow</strong><br>Low deprivation: <strong>50.4%</strong><br>Medium deprivation: <strong>40.2%</strong><br>High deprivation: <strong>9.4%</strong> <strong>Battersea</strong><br>Low deprivation: <strong>49.5%</strong><br>Medium deprivation: <strong>47.6%</strong><br>High deprivation: <strong>2.9%</strong> <strong>Beaconsfield</strong><br>Low deprivation: <strong>83.0%</strong><br>Medium deprivation: <strong>17.0%</strong><br>High deprivation: <strong>0%</strong> <strong>Beckenham and Penge</strong><br>Low deprivation: <strong>62.6%</strong><br>Medium deprivation: <strong>32.8%</strong><br>High deprivation: <strong>4.7%</strong> <strong>Bedford</strong><br>Low deprivation: <strong>33.9%</strong><br>Medium deprivation: <strong>47.5%</strong><br>High deprivation: <strong>18.5%</strong> <strong>Belfast East</strong><br>Low deprivation: <strong>1.9%</strong><br>Medium deprivation: <strong>53.2%</strong><br>High deprivation: <strong>44.9%</strong> <strong>Belfast North</strong><br>Low deprivation: <strong>0%</strong><br>Medium deprivation: <strong>24.1%</strong><br>High deprivation: <strong>75.9%</strong> <strong>Belfast South and Mid Down</strong><br>Low deprivation: <strong>3.3%</strong><br>Medium deprivation: <strong>69.4%</strong><br>High deprivation: <strong>27.3%</strong> <strong>Belfast West</strong><br>Low deprivation: <strong>0%</strong><br>Medium deprivation: <strong>4.0%</strong><br>High deprivation: <strong>96.0%</strong> <strong>Bermondsey and Old Southwark</strong><br>Low deprivation: <strong>17.3%</strong><br>Medium deprivation: <strong>74.0%</strong><br>High deprivation: <strong>8.7%</strong> <strong>Berwickshire, Roxburgh and Selkirk</strong><br>Low deprivation: <strong>53.8%</strong><br>Medium deprivation: <strong>40.4%</strong><br>High deprivation: <strong>5.8%</strong> <strong>Bethnal Green and Stepney</strong><br>Low deprivation: <strong>4.6%</strong><br>Medium deprivation: <strong>63.3%</strong><br>High deprivation: <strong>32.1%</strong> <strong>Beverley and Holderness</strong><br>Low deprivation: <strong>60.9%</strong><br>Medium deprivation: <strong>32.7%</strong><br>High deprivation: <strong>6.4%</strong> <strong>Bexhill and Battle</strong><br>Low deprivation: <strong>41.1%</strong><br>Medium deprivation: <strong>51.6%</strong><br>High deprivation: <strong>7.3%</strong> <strong>Bexleyheath and Crayford</strong><br>Low deprivation: <strong>53.9%</strong><br>Medium deprivation: <strong>38.5%</strong><br>High deprivation: <strong>7.6%</strong> <strong>Bicester and Woodstock</strong><br>Low deprivation: <strong>79.1%</strong><br>Medium deprivation: <strong>20.9%</strong><br>High deprivation: <strong>0%</strong> <strong>Birkenhead</strong><br>Low deprivation: <strong>16.4%</strong><br>Medium deprivation: <strong>33.9%</strong><br>High deprivation: <strong>49.7%</strong> <strong>Birmingham Edgbaston</strong><br>Low deprivation: <strong>15.2%</strong><br>Medium deprivation: <strong>44.2%</strong><br>High deprivation: <strong>40.6%</strong> <strong>Birmingham Erdington</strong><br>Low deprivation: <strong>0.9%</strong><br>Medium deprivation: <strong>34.9%</strong><br>High deprivation: <strong>64.2%</strong> <strong>Birmingham Hall Green and Moseley</strong><br>Low deprivation: <strong>3.7%</strong><br>Medium deprivation: <strong>36.9%</strong><br>High deprivation: <strong>59.4%</strong> <strong>Birmingham Hodge Hill and Solihull North</strong><br>Low deprivation: <strong>6.1%</strong><br>Medium deprivation: <strong>16.4%</strong><br>High deprivation: <strong>77.5%</strong> <strong>Birmingham Ladywood</strong><br>Low deprivation: <strong>1.9%</strong><br>Medium deprivation: <strong>16.3%</strong><br>High deprivation: <strong>81.7%</strong> <strong>Birmingham Northfield</strong><br>Low deprivation: <strong>5.3%</strong><br>Medium deprivation: <strong>38.3%</strong><br>High deprivation: <strong>56.4%</strong> <strong>Birmingham Perry Barr</strong><br>Low deprivation: <strong>1.2%</strong><br>Medium deprivation: <strong>29.2%</strong><br>High deprivation: <strong>69.6%</strong> <strong>Birmingham Selly Oak</strong><br>Low deprivation: <strong>6.6%</strong><br>Medium deprivation: <strong>59.0%</strong><br>High deprivation: <strong>34.4%</strong> <strong>Birmingham Yardley</strong><br>Low deprivation: <strong>0%</strong><br>Medium deprivation: <strong>24.9%</strong><br>High deprivation: <strong>75.1%</strong> <strong>Bishop Auckland</strong><br>Low deprivation: <strong>18.4%</strong><br>Medium deprivation: <strong>51.8%</strong><br>High deprivation: <strong>29.8%</strong> <strong>Blackburn</strong><br>Low deprivation: <strong>14.4%</strong><br>Medium deprivation: <strong>27.6%</strong><br>High deprivation: <strong>58.0%</strong> <strong>Blackley and Middleton South</strong><br>Low deprivation: <strong>5.9%</strong><br>Medium deprivation: <strong>26.8%</strong><br>High deprivation: <strong>67.2%</strong> <strong>Blackpool North and Fleetwood</strong><br>Low deprivation: <strong>25.5%</strong><br>Medium deprivation: <strong>49.3%</strong><br>High deprivation: <strong>25.2%</strong> <strong>Blackpool South</strong><br>Low deprivation: <strong>2.5%</strong><br>Medium deprivation: <strong>31.1%</strong><br>High deprivation: <strong>66.4%</strong> <strong>Blaenau Gwent and Rhymney</strong><br>Low deprivation: <strong>1.2%</strong><br>Medium deprivation: <strong>53.4%</strong><br>High deprivation: <strong>45.4%</strong> <strong>Blaydon and Consett</strong><br>Low deprivation: <strong>25.6%</strong><br>Medium deprivation: <strong>64.2%</strong><br>High deprivation: <strong>10.2%</strong> <strong>Blyth and Ashington</strong><br>Low deprivation: <strong>18.8%</strong><br>Medium deprivation: <strong>29.9%</strong><br>High deprivation: <strong>51.3%</strong> <strong>Bognor Regis and Littlehampton</strong><br>Low deprivation: <strong>30.7%</strong><br>Medium deprivation: <strong>56.7%</strong><br>High deprivation: <strong>12.6%</strong> <strong>Bolsover</strong><br>Low deprivation: <strong>21.3%</strong><br>Medium deprivation: <strong>59.6%</strong><br>High deprivation: <strong>19.1%</strong> <strong>Bolton North East</strong><br>Low deprivation: <strong>26.9%</strong><br>Medium deprivation: <strong>23.5%</strong><br>High deprivation: <strong>49.6%</strong> <strong>Bolton South and Walkden</strong><br>Low deprivation: <strong>7.3%</strong><br>Medium deprivation: <strong>24.2%</strong><br>High deprivation: <strong>68.5%</strong> <strong>Bolton West</strong><br>Low deprivation: <strong>44.8%</strong><br>Medium deprivation: <strong>37.2%</strong><br>High deprivation: <strong>18.0%</strong> <strong>Bootle</strong><br>Low deprivation: <strong>10.7%</strong><br>Medium deprivation: <strong>27.4%</strong><br>High deprivation: <strong>62.0%</strong> <strong>Boston and Skegness</strong><br>Low deprivation: <strong>17.2%</strong><br>Medium deprivation: <strong>54.9%</strong><br>High deprivation: <strong>27.9%</strong> <strong>Bournemouth East</strong><br>Low deprivation: <strong>35.8%</strong><br>Medium deprivation: <strong>47.5%</strong><br>High deprivation: <strong>16.7%</strong> <strong>Bournemouth West</strong><br>Low deprivation: <strong>31.4%</strong><br>Medium deprivation: <strong>59.2%</strong><br>High deprivation: <strong>9.4%</strong> <strong>Bracknell</strong><br>Low deprivation: <strong>74.1%</strong><br>Medium deprivation: <strong>25.9%</strong><br>High deprivation: <strong>0%</strong> <strong>Bradford East</strong><br>Low deprivation: <strong>4.7%</strong><br>Medium deprivation: <strong>24.1%</strong><br>High deprivation: <strong>71.2%</strong> <strong>Bradford South</strong><br>Low deprivation: <strong>3.5%</strong><br>Medium deprivation: <strong>37.8%</strong><br>High deprivation: <strong>58.8%</strong> <strong>Bradford West</strong><br>Low deprivation: <strong>2.4%</strong><br>Medium deprivation: <strong>36.6%</strong><br>High deprivation: <strong>61.0%</strong> <strong>Braintree</strong><br>Low deprivation: <strong>59.5%</strong><br>Medium deprivation: <strong>37.7%</strong><br>High deprivation: <strong>2.8%</strong> <strong>Brecon, Radnor and Cwm Tawe</strong><br>Low deprivation: <strong>37.6%</strong><br>Medium deprivation: <strong>61.2%</strong><br>High deprivation: <strong>1.3%</strong> <strong>Brent East</strong><br>Low deprivation: <strong>3.0%</strong><br>Medium deprivation: <strong>70.6%</strong><br>High deprivation: <strong>26.5%</strong> <strong>Brent West</strong><br>Low deprivation: <strong>19.5%</strong><br>Medium deprivation: <strong>76.4%</strong><br>High deprivation: <strong>4.0%</strong> <strong>Brentford and Isleworth</strong><br>Low deprivation: <strong>25.9%</strong><br>Medium deprivation: <strong>66.3%</strong><br>High deprivation: <strong>7.8%</strong> <strong>Brentwood and Ongar</strong><br>Low deprivation: <strong>65.9%</strong><br>Medium deprivation: <strong>34.1%</strong><br>High deprivation: <strong>0%</strong> <strong>Bridgend</strong><br>Low deprivation: <strong>57.2%</strong><br>Medium deprivation: <strong>35.0%</strong><br>High deprivation: <strong>7.8%</strong> <strong>Bridgwater</strong><br>Low deprivation: <strong>29.1%</strong><br>Medium deprivation: <strong>51.2%</strong><br>High deprivation: <strong>19.6%</strong> <strong>Bridlington and The Wolds</strong><br>Low deprivation: <strong>40.4%</strong><br>Medium deprivation: <strong>42.2%</strong><br>High deprivation: <strong>17.5%</strong> <strong>Brigg and Immingham</strong><br>Low deprivation: <strong>56.6%</strong><br>Medium deprivation: <strong>37.9%</strong><br>High deprivation: <strong>5.5%</strong> <strong>Brighton Kemptown and Peacehaven</strong><br>Low deprivation: <strong>32.4%</strong><br>Medium deprivation: <strong>38.3%</strong><br>High deprivation: <strong>29.3%</strong> <strong>Brighton Pavilion</strong><br>Low deprivation: <strong>55.5%</strong><br>Medium deprivation: <strong>33.6%</strong><br>High deprivation: <strong>10.8%</strong> <strong>Bristol Central</strong><br>Low deprivation: <strong>46.4%</strong><br>Medium deprivation: <strong>37.6%</strong><br>High deprivation: <strong>16.1%</strong> <strong>Bristol East</strong><br>Low deprivation: <strong>14.3%</strong><br>Medium deprivation: <strong>53.6%</strong><br>High deprivation: <strong>32.1%</strong> <strong>Bristol North East</strong><br>Low deprivation: <strong>19.9%</strong><br>Medium deprivation: <strong>66.4%</strong><br>High deprivation: <strong>13.7%</strong> <strong>Bristol North West</strong><br>Low deprivation: <strong>46.1%</strong><br>Medium deprivation: <strong>30.8%</strong><br>High deprivation: <strong>23.1%</strong> <strong>Bristol South</strong><br>Low deprivation: <strong>25.1%</strong><br>Medium deprivation: <strong>34.4%</strong><br>High deprivation: <strong>40.5%</strong> <strong>Broadland and Fakenham</strong><br>Low deprivation: <strong>55.9%</strong><br>Medium deprivation: <strong>44.1%</strong><br>High deprivation: <strong>0%</strong> <strong>Bromley and Biggin Hill</strong><br>Low deprivation: <strong>79.4%</strong><br>Medium deprivation: <strong>17.9%</strong><br>High deprivation: <strong>2.8%</strong> <strong>Bromsgrove</strong><br>Low deprivation: <strong>74.3%</strong><br>Medium deprivation: <strong>23.8%</strong><br>High deprivation: <strong>1.9%</strong> <strong>Broxbourne</strong><br>Low deprivation: <strong>44.4%</strong><br>Medium deprivation: <strong>51.9%</strong><br>High deprivation: <strong>3.7%</strong> <strong>Broxtowe</strong><br>Low deprivation: <strong>57.6%</strong><br>Medium deprivation: <strong>35.9%</strong><br>High deprivation: <strong>6.5%</strong> <strong>Buckingham and Bletchley</strong><br>Low deprivation: <strong>60.2%</strong><br>Medium deprivation: <strong>30.4%</strong><br>High deprivation: <strong>9.3%</strong> <strong>Burnley</strong><br>Low deprivation: <strong>13.9%</strong><br>Medium deprivation: <strong>31.6%</strong><br>High deprivation: <strong>54.5%</strong> <strong>Burton and Uttoxeter</strong><br>Low deprivation: <strong>39.9%</strong><br>Medium deprivation: <strong>41.0%</strong><br>High deprivation: <strong>19.1%</strong> <strong>Bury North</strong><br>Low deprivation: <strong>39.8%</strong><br>Medium deprivation: <strong>34.0%</strong><br>High deprivation: <strong>26.1%</strong> <strong>Bury South</strong><br>Low deprivation: <strong>24.4%</strong><br>Medium deprivation: <strong>50.6%</strong><br>High deprivation: <strong>25.0%</strong> <strong>Bury St Edmunds and Stowmarket</strong><br>Low deprivation: <strong>61.9%</strong><br>Medium deprivation: <strong>36.5%</strong><br>High deprivation: <strong>1.6%</strong> <strong>Caerfyrddin</strong><br>Low deprivation: <strong>20.2%</strong><br>Medium deprivation: <strong>79.8%</strong><br>High deprivation: <strong>0%</strong> <strong>Caerphilly</strong><br>Low deprivation: <strong>27.8%</strong><br>Medium deprivation: <strong>52.6%</strong><br>High deprivation: <strong>19.6%</strong> <strong>Caithness, Sutherland and Easter Ross</strong><br>Low deprivation: <strong>37.9%</strong><br>Medium deprivation: <strong>54.4%</strong><br>High deprivation: <strong>7.7%</strong> <strong>Calder Valley</strong><br>Low deprivation: <strong>35.1%</strong><br>Medium deprivation: <strong>54.7%</strong><br>High deprivation: <strong>10.2%</strong> <strong>Camborne and Redruth</strong><br>Low deprivation: <strong>14.7%</strong><br>Medium deprivation: <strong>64.6%</strong><br>High deprivation: <strong>20.7%</strong> <strong>Cambridge</strong><br>Low deprivation: <strong>60.5%</strong><br>Medium deprivation: <strong>35.4%</strong><br>High deprivation: <strong>4.1%</strong> <strong>Cannock Chase</strong><br>Low deprivation: <strong>36.3%</strong><br>Medium deprivation: <strong>53.6%</strong><br>High deprivation: <strong>10.1%</strong> <strong>Canterbury</strong><br>Low deprivation: <strong>62.9%</strong><br>Medium deprivation: <strong>27.2%</strong><br>High deprivation: <strong>9.9%</strong> <strong>Cardiff East</strong><br>Low deprivation: <strong>25.1%</strong><br>Medium deprivation: <strong>45.8%</strong><br>High deprivation: <strong>29.1%</strong> <strong>Cardiff North</strong><br>Low deprivation: <strong>71.0%</strong><br>Medium deprivation: <strong>21.4%</strong><br>High deprivation: <strong>7.6%</strong> <strong>Cardiff South and Penarth</strong><br>Low deprivation: <strong>37.8%</strong><br>Medium deprivation: <strong>42.9%</strong><br>High deprivation: <strong>19.3%</strong> <strong>Cardiff West</strong><br>Low deprivation: <strong>45.3%</strong><br>Medium deprivation: <strong>21.7%</strong><br>High deprivation: <strong>33.0%</strong> <strong>Carlisle</strong><br>Low deprivation: <strong>36.1%</strong><br>Medium deprivation: <strong>48.5%</strong><br>High deprivation: <strong>15.3%</strong> <strong>Carshalton and Wallington</strong><br>Low deprivation: <strong>51.2%</strong><br>Medium deprivation: <strong>43.0%</strong><br>High deprivation: <strong>5.8%</strong> <strong>Castle Point</strong><br>Low deprivation: <strong>48.8%</strong><br>Medium deprivation: <strong>42.6%</strong><br>High deprivation: <strong>8.6%</strong> <strong>Central Ayrshire</strong><br>Low deprivation: <strong>34.4%</strong><br>Medium deprivation: <strong>42.2%</strong><br>High deprivation: <strong>23.4%</strong> <strong>Central Devon</strong><br>Low deprivation: <strong>35.2%</strong><br>Medium deprivation: <strong>64.8%</strong><br>High deprivation: <strong>0%</strong> <strong>Central Suffolk and North Ipswich</strong><br>Low deprivation: <strong>66.8%</strong><br>Medium deprivation: <strong>25.3%</strong><br>High deprivation: <strong>7.9%</strong> <strong>Ceredigion Preseli</strong><br>Low deprivation: <strong>22.7%</strong><br>Medium deprivation: <strong>76.0%</strong><br>High deprivation: <strong>1.3%</strong> <strong>Chatham and Aylesford</strong><br>Low deprivation: <strong>36.7%</strong><br>Medium deprivation: <strong>36.2%</strong><br>High deprivation: <strong>27.1%</strong> <strong>Cheadle</strong><br>Low deprivation: <strong>73.8%</strong><br>Medium deprivation: <strong>22.0%</strong><br>High deprivation: <strong>4.2%</strong> <strong>Chelmsford</strong><br>Low deprivation: <strong>72.0%</strong><br>Medium deprivation: <strong>26.4%</strong><br>High deprivation: <strong>1.6%</strong> <strong>Chelsea and Fulham</strong><br>Low deprivation: <strong>42.6%</strong><br>Medium deprivation: <strong>50.2%</strong><br>High deprivation: <strong>7.2%</strong> <strong>Cheltenham</strong><br>Low deprivation: <strong>63.8%</strong><br>Medium deprivation: <strong>27.5%</strong><br>High deprivation: <strong>8.7%</strong> <strong>Chesham and Amersham</strong><br>Low deprivation: <strong>92.4%</strong><br>Medium deprivation: <strong>7.6%</strong><br>High deprivation: <strong>0%</strong> <strong>Chester North and Neston</strong><br>Low deprivation: <strong>55.1%</strong><br>Medium deprivation: <strong>34.0%</strong><br>High deprivation: <strong>11.0%</strong> <strong>Chester South and Eddisbury</strong><br>Low deprivation: <strong>73.2%</strong><br>Medium deprivation: <strong>25.3%</strong><br>High deprivation: <strong>1.5%</strong> <strong>Chesterfield</strong><br>Low deprivation: <strong>30.2%</strong><br>Medium deprivation: <strong>43.6%</strong><br>High deprivation: <strong>26.2%</strong> <strong>Chichester</strong><br>Low deprivation: <strong>45.2%</strong><br>Medium deprivation: <strong>53.6%</strong><br>High deprivation: <strong>1.2%</strong> <strong>Chingford and Woodford Green</strong><br>Low deprivation: <strong>40.7%</strong><br>Medium deprivation: <strong>53.8%</strong><br>High deprivation: <strong>5.6%</strong> <strong>Chippenham</strong><br>Low deprivation: <strong>65.1%</strong><br>Medium deprivation: <strong>33.7%</strong><br>High deprivation: <strong>1.2%</strong> <strong>Chipping Barnet</strong><br>Low deprivation: <strong>66.8%</strong><br>Medium deprivation: <strong>30.7%</strong><br>High deprivation: <strong>2.5%</strong> <strong>Chorley</strong><br>Low deprivation: <strong>50.9%</strong><br>Medium deprivation: <strong>35.9%</strong><br>High deprivation: <strong>13.3%</strong> <strong>Christchurch</strong><br>Low deprivation: <strong>79.7%</strong><br>Medium deprivation: <strong>16.4%</strong><br>High deprivation: <strong>3.9%</strong> <strong>Cities of London and Westminster</strong><br>Low deprivation: <strong>49.3%</strong><br>Medium deprivation: <strong>45.0%</strong><br>High deprivation: <strong>5.7%</strong> <strong>City of Durham</strong><br>Low deprivation: <strong>49.8%</strong><br>Medium deprivation: <strong>37.6%</strong><br>High deprivation: <strong>12.6%</strong> <strong>Clacton</strong><br>Low deprivation: <strong>8.6%</strong><br>Medium deprivation: <strong>56.1%</strong><br>High deprivation: <strong>35.3%</strong> <strong>Clapham and Brixton Hill</strong><br>Low deprivation: <strong>6.8%</strong><br>Medium deprivation: <strong>78.6%</strong><br>High deprivation: <strong>14.6%</strong> <strong>Clwyd East</strong><br>Low deprivation: <strong>42.9%</strong><br>Medium deprivation: <strong>51.9%</strong><br>High deprivation: <strong>5.2%</strong> <strong>Clwyd North</strong><br>Low deprivation: <strong>32.5%</strong><br>Medium deprivation: <strong>41.9%</strong><br>High deprivation: <strong>25.6%</strong> <strong>Coatbridge and Bellshill</strong><br>Low deprivation: <strong>27.3%</strong><br>Medium deprivation: <strong>39.1%</strong><br>High deprivation: <strong>33.5%</strong> <strong>Colchester</strong><br>Low deprivation: <strong>37.1%</strong><br>Medium deprivation: <strong>53.0%</strong><br>High deprivation: <strong>9.9%</strong> <strong>Colne Valley</strong><br>Low deprivation: <strong>55.3%</strong><br>Medium deprivation: <strong>38.0%</strong><br>High deprivation: <strong>6.7%</strong> <strong>Congleton</strong><br>Low deprivation: <strong>74.8%</strong><br>Medium deprivation: <strong>20.5%</strong><br>High deprivation: <strong>4.7%</strong> <strong>Corby and East Northamptonshire</strong><br>Low deprivation: <strong>45.5%</strong><br>Medium deprivation: <strong>40.4%</strong><br>High deprivation: <strong>14.1%</strong> <strong>Coventry East</strong><br>Low deprivation: <strong>8.9%</strong><br>Medium deprivation: <strong>49.7%</strong><br>High deprivation: <strong>41.4%</strong> <strong>Coventry North West</strong><br>Low deprivation: <strong>31.5%</strong><br>Medium deprivation: <strong>49.9%</strong><br>High deprivation: <strong>18.6%</strong> <strong>Coventry South</strong><br>Low deprivation: <strong>30.7%</strong><br>Medium deprivation: <strong>56.4%</strong><br>High deprivation: <strong>12.9%</strong> <strong>Cowdenbeath and Kirkcaldy</strong><br>Low deprivation: <strong>43.2%</strong><br>Medium deprivation: <strong>37.2%</strong><br>High deprivation: <strong>19.6%</strong> <strong>Cramlington and Killingworth</strong><br>Low deprivation: <strong>37.9%</strong><br>Medium deprivation: <strong>51.3%</strong><br>High deprivation: <strong>10.8%</strong> <strong>Crawley</strong><br>Low deprivation: <strong>28.0%</strong><br>Medium deprivation: <strong>70.5%</strong><br>High deprivation: <strong>1.5%</strong> <strong>Crewe and Nantwich</strong><br>Low deprivation: <strong>46.6%</strong><br>Medium deprivation: <strong>32.6%</strong><br>High deprivation: <strong>20.7%</strong> <strong>Croydon East</strong><br>Low deprivation: <strong>37.7%</strong><br>Medium deprivation: <strong>36.1%</strong><br>High deprivation: <strong>26.3%</strong> <strong>Croydon South</strong><br>Low deprivation: <strong>60.8%</strong><br>Medium deprivation: <strong>34.7%</strong><br>High deprivation: <strong>4.5%</strong> <strong>Croydon West</strong><br>Low deprivation: <strong>0%</strong><br>Medium deprivation: <strong>75.4%</strong><br>High deprivation: <strong>24.6%</strong> <strong>Cumbernauld and Kirkintilloch</strong><br>Low deprivation: <strong>42.3%</strong><br>Medium deprivation: <strong>47.8%</strong><br>High deprivation: <strong>9.8%</strong> <strong>Dagenham and Rainham</strong><br>Low deprivation: <strong>17.7%</strong><br>Medium deprivation: <strong>54.3%</strong><br>High deprivation: <strong>28.0%</strong> <strong>Darlington</strong><br>Low deprivation: <strong>30.4%</strong><br>Medium deprivation: <strong>38.0%</strong><br>High deprivation: <strong>31.6%</strong> <strong>Dartford</strong><br>Low deprivation: <strong>37.6%</strong><br>Medium deprivation: <strong>49.8%</strong><br>High deprivation: <strong>12.6%</strong> <strong>Daventry</strong><br>Low deprivation: <strong>75.5%</strong><br>Medium deprivation: <strong>21.4%</strong><br>High deprivation: <strong>3.1%</strong> <strong>Derby North</strong><br>Low deprivation: <strong>31.0%</strong><br>Medium deprivation: <strong>51.0%</strong><br>High deprivation: <strong>18.0%</strong> <strong>Derby South</strong><br>Low deprivation: <strong>14.5%</strong><br>Medium deprivation: <strong>25.9%</strong><br>High deprivation: <strong>59.6%</strong> <strong>Derbyshire Dales</strong><br>Low deprivation: <strong>75.4%</strong><br>Medium deprivation: <strong>22.8%</strong><br>High deprivation: <strong>1.8%</strong> <strong>Dewsbury and Batley</strong><br>Low deprivation: <strong>15.0%</strong><br>Medium deprivation: <strong>36.9%</strong><br>High deprivation: <strong>48.1%</strong> <strong>Didcot and Wantage</strong><br>Low deprivation: <strong>88.0%</strong><br>Medium deprivation: <strong>12.0%</strong><br>High deprivation: <strong>0%</strong> <strong>Doncaster Central</strong><br>Low deprivation: <strong>27.7%</strong><br>Medium deprivation: <strong>32.0%</strong><br>High deprivation: <strong>40.3%</strong> <strong>Doncaster East and the Isle of Axholme</strong><br>Low deprivation: <strong>40.1%</strong><br>Medium deprivation: <strong>38.8%</strong><br>High deprivation: <strong>21.1%</strong> <strong>Doncaster North</strong><br>Low deprivation: <strong>21.5%</strong><br>Medium deprivation: <strong>41.7%</strong><br>High deprivation: <strong>36.8%</strong> <strong>Dorking and Horley</strong><br>Low deprivation: <strong>74.5%</strong><br>Medium deprivation: <strong>25.5%</strong><br>High deprivation: <strong>0%</strong> <strong>Dover and Deal</strong><br>Low deprivation: <strong>30.9%</strong><br>Medium deprivation: <strong>47.8%</strong><br>High deprivation: <strong>21.3%</strong> <strong>Droitwich and Evesham</strong><br>Low deprivation: <strong>50.5%</strong><br>Medium deprivation: <strong>44.6%</strong><br>High deprivation: <strong>4.8%</strong> <strong>Dudley</strong><br>Low deprivation: <strong>20.4%</strong><br>Medium deprivation: <strong>30.7%</strong><br>High deprivation: <strong>48.9%</strong> <strong>Dulwich and West Norwood</strong><br>Low deprivation: <strong>18.8%</strong><br>Medium deprivation: <strong>59.4%</strong><br>High deprivation: <strong>21.8%</strong> <strong>Dumfries and Galloway</strong><br>Low deprivation: <strong>33.7%</strong><br>Medium deprivation: <strong>57.0%</strong><br>High deprivation: <strong>9.3%</strong> <strong>Dumfriesshire, Clydesdale and Tweeddale</strong><br>Low deprivation: <strong>48.9%</strong><br>Medium deprivation: <strong>48.4%</strong><br>High deprivation: <strong>2.7%</strong> <strong>Dundee Central</strong><br>Low deprivation: <strong>30.8%</strong><br>Medium deprivation: <strong>31.5%</strong><br>High deprivation: <strong>37.7%</strong> <strong>Dunfermline and Dollar</strong><br>Low deprivation: <strong>57.0%</strong><br>Medium deprivation: <strong>33.1%</strong><br>High deprivation: <strong>9.9%</strong> <strong>Dunstable and Leighton Buzzard</strong><br>Low deprivation: <strong>56.7%</strong><br>Medium deprivation: <strong>39.4%</strong><br>High deprivation: <strong>3.9%</strong> <strong>Dwyfor Meirionnydd</strong><br>Low deprivation: <strong>30.7%</strong><br>Medium deprivation: <strong>64.6%</strong><br>High deprivation: <strong>4.7%</strong> <strong>Ealing Central and Acton</strong><br>Low deprivation: <strong>25.0%</strong><br>Medium deprivation: <strong>64.2%</strong><br>High deprivation: <strong>10.8%</strong> <strong>Ealing North</strong><br>Low deprivation: <strong>19.7%</strong><br>Medium deprivation: <strong>65.9%</strong><br>High deprivation: <strong>14.3%</strong> <strong>Ealing Southall</strong><br>Low deprivation: <strong>18.9%</strong><br>Medium deprivation: <strong>61.3%</strong><br>High deprivation: <strong>19.8%</strong> <strong>Earley and Woodley</strong><br>Low deprivation: <strong>77.3%</strong><br>Medium deprivation: <strong>16.1%</strong><br>High deprivation: <strong>6.6%</strong> <strong>Easington</strong><br>Low deprivation: <strong>8.3%</strong><br>Medium deprivation: <strong>39.2%</strong><br>High deprivation: <strong>52.6%</strong> <strong>East Antrim</strong><br>Low deprivation: <strong>2.3%</strong><br>Medium deprivation: <strong>58.1%</strong><br>High deprivation: <strong>39.6%</strong> <strong>East Grinstead and Uckfield</strong><br>Low deprivation: <strong>84.8%</strong><br>Medium deprivation: <strong>15.2%</strong><br>High deprivation: <strong>0%</strong> <strong>East Ham</strong><br>Low deprivation: <strong>0%</strong><br>Medium deprivation: <strong>90.2%</strong><br>High deprivation: <strong>9.8%</strong> <strong>East Hampshire</strong><br>Low deprivation: <strong>78.8%</strong><br>Medium deprivation: <strong>21.2%</strong><br>High deprivation: <strong>0%</strong> <strong>East Kilbride and Strathaven</strong><br>Low deprivation: <strong>48.2%</strong><br>Medium deprivation: <strong>49.6%</strong><br>High deprivation: <strong>2.2%</strong> <strong>East Londonderry</strong><br>Low deprivation: <strong>0%</strong><br>Medium deprivation: <strong>20.9%</strong><br>High deprivation: <strong>79.1%</strong> <strong>East Renfrewshire</strong><br>Low deprivation: <strong>79.0%</strong><br>Medium deprivation: <strong>17.3%</strong><br>High deprivation: <strong>3.7%</strong> <strong>East Surrey</strong><br>Low deprivation: <strong>69.3%</strong><br>Medium deprivation: <strong>29.2%</strong><br>High deprivation: <strong>1.5%</strong> <strong>East Thanet</strong><br>Low deprivation: <strong>19.0%</strong><br>Medium deprivation: <strong>36.5%</strong><br>High deprivation: <strong>44.5%</strong> <strong>East Wiltshire</strong><br>Low deprivation: <strong>75.3%</strong><br>Medium deprivation: <strong>24.7%</strong><br>High deprivation: <strong>0%</strong> <strong>East Worthing and Shoreham</strong><br>Low deprivation: <strong>51.6%</strong><br>Medium deprivation: <strong>45.6%</strong><br>High deprivation: <strong>2.8%</strong> <strong>Eastbourne</strong><br>Low deprivation: <strong>28.5%</strong><br>Medium deprivation: <strong>53.3%</strong><br>High deprivation: <strong>18.3%</strong> <strong>Eastleigh</strong><br>Low deprivation: <strong>74.9%</strong><br>Medium deprivation: <strong>25.1%</strong><br>High deprivation: <strong>0%</strong> <strong>Edinburgh East and Musselburgh</strong><br>Low deprivation: <strong>49.5%</strong><br>Medium deprivation: <strong>37.9%</strong><br>High deprivation: <strong>12.6%</strong> <strong>Edinburgh North and Leith</strong><br>Low deprivation: <strong>58.8%</strong><br>Medium deprivation: <strong>29.1%</strong><br>High deprivation: <strong>12.1%</strong> <strong>Edinburgh South</strong><br>Low deprivation: <strong>75.4%</strong><br>Medium deprivation: <strong>17.3%</strong><br>High deprivation: <strong>7.3%</strong> <strong>Edinburgh South West</strong><br>Low deprivation: <strong>65.1%</strong><br>Medium deprivation: <strong>24.7%</strong><br>High deprivation: <strong>10.2%</strong> <strong>Edinburgh West</strong><br>Low deprivation: <strong>75.4%</strong><br>Medium deprivation: <strong>22.0%</strong><br>High deprivation: <strong>2.6%</strong> <strong>Edmonton and Winchmore Hill</strong><br>Low deprivation: <strong>20.1%</strong><br>Medium deprivation: <strong>42.4%</strong><br>High deprivation: <strong>37.5%</strong> <strong>Ellesmere Port and Bromborough</strong><br>Low deprivation: <strong>41.6%</strong><br>Medium deprivation: <strong>24.6%</strong><br>High deprivation: <strong>33.8%</strong> <strong>Eltham and Chislehurst</strong><br>Low deprivation: <strong>35.6%</strong><br>Medium deprivation: <strong>49.3%</strong><br>High deprivation: <strong>15.1%</strong> <strong>Ely and East Cambridgeshire</strong><br>Low deprivation: <strong>68.4%</strong><br>Medium deprivation: <strong>31.6%</strong><br>High deprivation: <strong>0%</strong> <strong>Enfield North</strong><br>Low deprivation: <strong>17.6%</strong><br>Medium deprivation: <strong>52.8%</strong><br>High deprivation: <strong>29.6%</strong> <strong>Epping Forest</strong><br>Low deprivation: <strong>56.3%</strong><br>Medium deprivation: <strong>42.0%</strong><br>High deprivation: <strong>1.7%</strong> <strong>Epsom and Ewell</strong><br>Low deprivation: <strong>85.7%</strong><br>Medium deprivation: <strong>14.3%</strong><br>High deprivation: <strong>0%</strong> <strong>Erewash</strong><br>Low deprivation: <strong>44.2%</strong><br>Medium deprivation: <strong>40.1%</strong><br>High deprivation: <strong>15.6%</strong> <strong>Erith and Thamesmead</strong><br>Low deprivation: <strong>7.9%</strong><br>Medium deprivation: <strong>80.3%</strong><br>High deprivation: <strong>11.8%</strong> <strong>Esher and Walton</strong><br>Low deprivation: <strong>83.7%</strong><br>Medium deprivation: <strong>16.3%</strong><br>High deprivation: <strong>0%</strong> <strong>Exeter</strong><br>Low deprivation: <strong>50.3%</strong><br>Medium deprivation: <strong>39.3%</strong><br>High deprivation: <strong>10.4%</strong> <strong>Exmouth and Exeter East</strong><br>Low deprivation: <strong>61.9%</strong><br>Medium deprivation: <strong>36.1%</strong><br>High deprivation: <strong>1.9%</strong> <strong>Falkirk</strong><br>Low deprivation: <strong>40.9%</strong><br>Medium deprivation: <strong>44.3%</strong><br>High deprivation: <strong>14.7%</strong> <strong>Fareham and Waterlooville</strong><br>Low deprivation: <strong>68.1%</strong><br>Medium deprivation: <strong>28.2%</strong><br>High deprivation: <strong>3.7%</strong> <strong>Farnham and Bordon</strong><br>Low deprivation: <strong>87.5%</strong><br>Medium deprivation: <strong>12.5%</strong><br>High deprivation: <strong>0%</strong> <strong>Faversham and Mid Kent</strong><br>Low deprivation: <strong>46.4%</strong><br>Medium deprivation: <strong>39.1%</strong><br>High deprivation: <strong>14.5%</strong> <strong>Feltham and Heston</strong><br>Low deprivation: <strong>4.5%</strong><br>Medium deprivation: <strong>86.1%</strong><br>High deprivation: <strong>9.4%</strong> <strong>Fermanagh and South Tyrone</strong><br>Low deprivation: <strong>0%</strong><br>Medium deprivation: <strong>16.4%</strong><br>High deprivation: <strong>83.6%</strong> <strong>Filton and Bradley Stoke</strong><br>Low deprivation: <strong>77.8%</strong><br>Medium deprivation: <strong>22.2%</strong><br>High deprivation: <strong>0%</strong> <strong>Finchley and Golders Green</strong><br>Low deprivation: <strong>62.6%</strong><br>Medium deprivation: <strong>35.2%</strong><br>High deprivation: <strong>2.2%</strong> <strong>Folkestone and Hythe</strong><br>Low deprivation: <strong>19.0%</strong><br>Medium deprivation: <strong>59.0%</strong><br>High deprivation: <strong>22.0%</strong> <strong>Forest of Dean</strong><br>Low deprivation: <strong>36.9%</strong><br>Medium deprivation: <strong>61.4%</strong><br>High deprivation: <strong>1.6%</strong> <strong>Foyle</strong><br>Low deprivation: <strong>0%</strong><br>Medium deprivation: <strong>20.9%</strong><br>High deprivation: <strong>79.1%</strong> <strong>Frome and East Somerset</strong><br>Low deprivation: <strong>55.0%</strong><br>Medium deprivation: <strong>43.5%</strong><br>High deprivation: <strong>1.5%</strong> <strong>Fylde</strong><br>Low deprivation: <strong>59.9%</strong><br>Medium deprivation: <strong>34.4%</strong><br>High deprivation: <strong>5.7%</strong> <strong>Gainsborough</strong><br>Low deprivation: <strong>43.0%</strong><br>Medium deprivation: <strong>39.9%</strong><br>High deprivation: <strong>17.0%</strong> <strong>Gateshead Central and Whickham</strong><br>Low deprivation: <strong>23.7%</strong><br>Medium deprivation: <strong>42.2%</strong><br>High deprivation: <strong>34.1%</strong> <strong>Gedling</strong><br>Low deprivation: <strong>54.7%</strong><br>Medium deprivation: <strong>42.7%</strong><br>High deprivation: <strong>2.6%</strong> <strong>Gillingham and Rainham</strong><br>Low deprivation: <strong>40.2%</strong><br>Medium deprivation: <strong>38.4%</strong><br>High deprivation: <strong>21.4%</strong> <strong>Glasgow East</strong><br>Low deprivation: <strong>18.9%</strong><br>Medium deprivation: <strong>33.2%</strong><br>High deprivation: <strong>47.9%</strong> <strong>Glasgow North</strong><br>Low deprivation: <strong>41.8%</strong><br>Medium deprivation: <strong>27.1%</strong><br>High deprivation: <strong>31.1%</strong> <strong>Glasgow North East</strong><br>Low deprivation: <strong>12.4%</strong><br>Medium deprivation: <strong>31.9%</strong><br>High deprivation: <strong>55.6%</strong> <strong>Glasgow South</strong><br>Low deprivation: <strong>36.8%</strong><br>Medium deprivation: <strong>35.9%</strong><br>High deprivation: <strong>27.3%</strong> <strong>Glasgow South West</strong><br>Low deprivation: <strong>22.0%</strong><br>Medium deprivation: <strong>34.5%</strong><br>High deprivation: <strong>43.5%</strong> <strong>Glasgow West</strong><br>Low deprivation: <strong>38.1%</strong><br>Medium deprivation: <strong>26.8%</strong><br>High deprivation: <strong>35.0%</strong> <strong>Glastonbury and Somerton</strong><br>Low deprivation: <strong>45.6%</strong><br>Medium deprivation: <strong>52.8%</strong><br>High deprivation: <strong>1.6%</strong> <strong>Glenrothes and Mid Fife</strong><br>Low deprivation: <strong>23.2%</strong><br>Medium deprivation: <strong>46.4%</strong><br>High deprivation: <strong>30.3%</strong> <strong>Gloucester</strong><br>Low deprivation: <strong>39.5%</strong><br>Medium deprivation: <strong>31.1%</strong><br>High deprivation: <strong>29.4%</strong> <strong>Godalming and Ash</strong><br>Low deprivation: <strong>87.2%</strong><br>Medium deprivation: <strong>12.8%</strong><br>High deprivation: <strong>0%</strong> <strong>Goole and Pocklington</strong><br>Low deprivation: <strong>74.7%</strong><br>Medium deprivation: <strong>21.4%</strong><br>High deprivation: <strong>3.9%</strong> <strong>Gordon and Buchan</strong><br>Low deprivation: <strong>80.8%</strong><br>Medium deprivation: <strong>19.2%</strong><br>High deprivation: <strong>0%</strong> <strong>Gorton and Denton</strong><br>Low deprivation: <strong>6.4%</strong><br>Medium deprivation: <strong>23.1%</strong><br>High deprivation: <strong>70.4%</strong> <strong>Gosport</strong><br>Low deprivation: <strong>48.1%</strong><br>Medium deprivation: <strong>37.7%</strong><br>High deprivation: <strong>14.2%</strong> <strong>Gower</strong><br>Low deprivation: <strong>59.3%</strong><br>Medium deprivation: <strong>30.0%</strong><br>High deprivation: <strong>10.6%</strong> <strong>Grantham and Bourne</strong><br>Low deprivation: <strong>60.0%</strong><br>Medium deprivation: <strong>35.4%</strong><br>High deprivation: <strong>4.6%</strong> <strong>Gravesham</strong><br>Low deprivation: <strong>37.7%</strong><br>Medium deprivation: <strong>42.4%</strong><br>High deprivation: <strong>20.0%</strong> <strong>Great Grimsby and Cleethorpes</strong><br>Low deprivation: <strong>18.8%</strong><br>Medium deprivation: <strong>31.1%</strong><br>High deprivation: <strong>50.2%</strong> <strong>Great Yarmouth</strong><br>Low deprivation: <strong>13.4%</strong><br>Medium deprivation: <strong>48.2%</strong><br>High deprivation: <strong>38.5%</strong> <strong>Greenwich and Woolwich</strong><br>Low deprivation: <strong>22.2%</strong><br>Medium deprivation: <strong>64.8%</strong><br>High deprivation: <strong>13.0%</strong> <strong>Guildford</strong><br>Low deprivation: <strong>78.6%</strong><br>Medium deprivation: <strong>21.4%</strong><br>High deprivation: <strong>0%</strong> <strong>Hackney North and Stoke Newington</strong><br>Low deprivation: <strong>0%</strong><br>Medium deprivation: <strong>73.3%</strong><br>High deprivation: <strong>26.7%</strong> <strong>Hackney South and Shoreditch</strong><br>Low deprivation: <strong>0%</strong><br>Medium deprivation: <strong>54.9%</strong><br>High deprivation: <strong>45.1%</strong> <strong>Halesowen</strong><br>Low deprivation: <strong>29.3%</strong><br>Medium deprivation: <strong>47.4%</strong><br>High deprivation: <strong>23.3%</strong> <strong>Halifax</strong><br>Low deprivation: <strong>18.5%</strong><br>Medium deprivation: <strong>35.3%</strong><br>High deprivation: <strong>46.2%</strong> <strong>Hamble Valley</strong><br>Low deprivation: <strong>89.3%</strong><br>Medium deprivation: <strong>9.2%</strong><br>High deprivation: <strong>1.5%</strong> <strong>Hamilton and Clyde Valley</strong><br>Low deprivation: <strong>37.2%</strong><br>Medium deprivation: <strong>38.3%</strong><br>High deprivation: <strong>24.5%</strong> <strong>Hammersmith and Chiswick</strong><br>Low deprivation: <strong>29.9%</strong><br>Medium deprivation: <strong>55.9%</strong><br>High deprivation: <strong>14.3%</strong> <strong>Hampstead and Highgate</strong><br>Low deprivation: <strong>56.7%</strong><br>Medium deprivation: <strong>38.2%</strong><br>High deprivation: <strong>5.2%</strong> <strong>Harborough, Oadby and Wigston</strong><br>Low deprivation: <strong>77.4%</strong><br>Medium deprivation: <strong>22.6%</strong><br>High deprivation: <strong>0%</strong> <strong>Harlow</strong><br>Low deprivation: <strong>32.6%</strong><br>Medium deprivation: <strong>67.4%</strong><br>High deprivation: <strong>0%</strong> <strong>Harpenden and Berkhamsted</strong><br>Low deprivation: <strong>90.4%</strong><br>Medium deprivation: <strong>9.6%</strong><br>High deprivation: <strong>0%</strong> <strong>Harrogate and Knaresborough</strong><br>Low deprivation: <strong>79.6%</strong><br>Medium deprivation: <strong>18.9%</strong><br>High deprivation: <strong>1.4%</strong> <strong>Harrow East</strong><br>Low deprivation: <strong>44.8%</strong><br>Medium deprivation: <strong>53.7%</strong><br>High deprivation: <strong>1.5%</strong> <strong>Harrow West</strong><br>Low deprivation: <strong>49.0%</strong><br>Medium deprivation: <strong>51.0%</strong><br>High deprivation: <strong>0%</strong> <strong>Hartlepool</strong><br>Low deprivation: <strong>28.0%</strong><br>Medium deprivation: <strong>21.4%</strong><br>High deprivation: <strong>50.6%</strong> <strong>Harwich and North Essex</strong><br>Low deprivation: <strong>46.0%</strong><br>Medium deprivation: <strong>44.3%</strong><br>High deprivation: <strong>9.7%</strong> <strong>Hastings and Rye</strong><br>Low deprivation: <strong>12.8%</strong><br>Medium deprivation: <strong>47.3%</strong><br>High deprivation: <strong>39.8%</strong> <strong>Havant</strong><br>Low deprivation: <strong>35.8%</strong><br>Medium deprivation: <strong>30.9%</strong><br>High deprivation: <strong>33.3%</strong> <strong>Hayes and Harlington</strong><br>Low deprivation: <strong>8.2%</strong><br>Medium deprivation: <strong>83.3%</strong><br>High deprivation: <strong>8.5%</strong> <strong>Hazel Grove</strong><br>Low deprivation: <strong>40.0%</strong><br>Medium deprivation: <strong>43.9%</strong><br>High deprivation: <strong>16.1%</strong> <strong>Hemel Hempstead</strong><br>Low deprivation: <strong>43.9%</strong><br>Medium deprivation: <strong>54.7%</strong><br>High deprivation: <strong>1.4%</strong> <strong>Hendon</strong><br>Low deprivation: <strong>35.9%</strong><br>Medium deprivation: <strong>61.5%</strong><br>High deprivation: <strong>2.6%</strong> <strong>Henley and Thame</strong><br>Low deprivation: <strong>88.8%</strong><br>Medium deprivation: <strong>8.4%</strong><br>High deprivation: <strong>2.8%</strong> <strong>Hereford and South Herefordshire</strong><br>Low deprivation: <strong>25.1%</strong><br>Medium deprivation: <strong>67.0%</strong><br>High deprivation: <strong>8.0%</strong> <strong>Herne Bay and Sandwich</strong><br>Low deprivation: <strong>33.8%</strong><br>Medium deprivation: <strong>56.7%</strong><br>High deprivation: <strong>9.5%</strong> <strong>Hertford and Stortford</strong><br>Low deprivation: <strong>89.1%</strong><br>Medium deprivation: <strong>10.9%</strong><br>High deprivation: <strong>0%</strong> <strong>Hertsmere</strong><br>Low deprivation: <strong>60.4%</strong><br>Medium deprivation: <strong>38.1%</strong><br>High deprivation: <strong>1.5%</strong> <strong>Hexham</strong><br>Low deprivation: <strong>51.7%</strong><br>Medium deprivation: <strong>37.7%</strong><br>High deprivation: <strong>10.7%</strong> <strong>Heywood and Middleton North</strong><br>Low deprivation: <strong>21.2%</strong><br>Medium deprivation: <strong>36.7%</strong><br>High deprivation: <strong>42.2%</strong> <strong>High Peak</strong><br>Low deprivation: <strong>57.1%</strong><br>Medium deprivation: <strong>38.3%</strong><br>High deprivation: <strong>4.6%</strong> <strong>Hinckley and Bosworth</strong><br>Low deprivation: <strong>62.1%</strong><br>Medium deprivation: <strong>36.5%</strong><br>High deprivation: <strong>1.3%</strong> <strong>Hitchin</strong><br>Low deprivation: <strong>80.4%</strong><br>Medium deprivation: <strong>19.6%</strong><br>High deprivation: <strong>0%</strong> <strong>Holborn and St Pancras</strong><br>Low deprivation: <strong>18.2%</strong><br>Medium deprivation: <strong>63.6%</strong><br>High deprivation: <strong>18.2%</strong> <strong>Honiton and Sidmouth</strong><br>Low deprivation: <strong>61.3%</strong><br>Medium deprivation: <strong>38.7%</strong><br>High deprivation: <strong>0%</strong> <strong>Hornchurch and Upminster</strong><br>Low deprivation: <strong>56.4%</strong><br>Medium deprivation: <strong>33.4%</strong><br>High deprivation: <strong>10.2%</strong> <strong>Hornsey and Friern Barnet</strong><br>Low deprivation: <strong>39.0%</strong><br>Medium deprivation: <strong>53.6%</strong><br>High deprivation: <strong>7.5%</strong> <strong>Horsham</strong><br>Low deprivation: <strong>75.1%</strong><br>Medium deprivation: <strong>24.9%</strong><br>High deprivation: <strong>0%</strong> <strong>Houghton and Sunderland South</strong><br>Low deprivation: <strong>19.3%</strong><br>Medium deprivation: <strong>42.5%</strong><br>High deprivation: <strong>38.1%</strong> <strong>Hove and Portslade</strong><br>Low deprivation: <strong>43.2%</strong><br>Medium deprivation: <strong>49.7%</strong><br>High deprivation: <strong>7.1%</strong> <strong>Huddersfield</strong><br>Low deprivation: <strong>17.6%</strong><br>Medium deprivation: <strong>41.2%</strong><br>High deprivation: <strong>41.3%</strong> <strong>Huntingdon</strong><br>Low deprivation: <strong>69.0%</strong><br>Medium deprivation: <strong>29.5%</strong><br>High deprivation: <strong>1.5%</strong> <strong>Hyndburn</strong><br>Low deprivation: <strong>20.9%</strong><br>Medium deprivation: <strong>32.6%</strong><br>High deprivation: <strong>46.5%</strong> <strong>Ilford North</strong><br>Low deprivation: <strong>45.4%</strong><br>Medium deprivation: <strong>51.6%</strong><br>High deprivation: <strong>2.9%</strong> <strong>Ilford South</strong><br>Low deprivation: <strong>12.1%</strong><br>Medium deprivation: <strong>78.0%</strong><br>High deprivation: <strong>9.8%</strong> <strong>Inverclyde and Renfrewshire West</strong><br>Low deprivation: <strong>45.0%</strong><br>Medium deprivation: <strong>20.3%</strong><br>High deprivation: <strong>34.8%</strong> <strong>Inverness, Skye and West Ross-shire</strong><br>Low deprivation: <strong>48.0%</strong><br>Medium deprivation: <strong>42.5%</strong><br>High deprivation: <strong>9.5%</strong> <strong>Ipswich</strong><br>Low deprivation: <strong>26.9%</strong><br>Medium deprivation: <strong>42.4%</strong><br>High deprivation: <strong>30.8%</strong> <strong>Isle of Wight East</strong><br>Low deprivation: <strong>23.0%</strong><br>Medium deprivation: <strong>63.5%</strong><br>High deprivation: <strong>13.6%</strong> <strong>Isle of Wight West</strong><br>Low deprivation: <strong>21.6%</strong><br>Medium deprivation: <strong>66.9%</strong><br>High deprivation: <strong>11.4%</strong> <strong>Islington North</strong><br>Low deprivation: <strong>4.8%</strong><br>Medium deprivation: <strong>68.4%</strong><br>High deprivation: <strong>26.7%</strong> <strong>Islington South and Finsbury</strong><br>Low deprivation: <strong>9.2%</strong><br>Medium deprivation: <strong>71.9%</strong><br>High deprivation: <strong>18.9%</strong> <strong>Jarrow and Gateshead East</strong><br>Low deprivation: <strong>13.3%</strong><br>Medium deprivation: <strong>34.3%</strong><br>High deprivation: <strong>52.4%</strong> <strong>Keighley and Ilkley</strong><br>Low deprivation: <strong>43.9%</strong><br>Medium deprivation: <strong>24.9%</strong><br>High deprivation: <strong>31.2%</strong> <strong>Kenilworth and Southam</strong><br>Low deprivation: <strong>87.6%</strong><br>Medium deprivation: <strong>12.4%</strong><br>High deprivation: <strong>0%</strong> <strong>Kensington and Bayswater</strong><br>Low deprivation: <strong>45.9%</strong><br>Medium deprivation: <strong>36.8%</strong><br>High deprivation: <strong>17.3%</strong> <strong>Kettering</strong><br>Low deprivation: <strong>52.1%</strong><br>Medium deprivation: <strong>36.9%</strong><br>High deprivation: <strong>11.0%</strong> <strong>Kilmarnock and Loudoun</strong><br>Low deprivation: <strong>37.8%</strong><br>Medium deprivation: <strong>35.9%</strong><br>High deprivation: <strong>26.3%</strong> <strong>Kingston and Surbiton</strong><br>Low deprivation: <strong>72.7%</strong><br>Medium deprivation: <strong>25.7%</strong><br>High deprivation: <strong>1.6%</strong> <strong>Kingston upon Hull East</strong><br>Low deprivation: <strong>15.7%</strong><br>Medium deprivation: <strong>29.9%</strong><br>High deprivation: <strong>54.5%</strong> <strong>Kingston upon Hull North and Cottingham</strong><br>Low deprivation: <strong>21.2%</strong><br>Medium deprivation: <strong>34.1%</strong><br>High deprivation: <strong>44.7%</strong> <strong>Kingston upon Hull West and Haltemprice</strong><br>Low deprivation: <strong>31.2%</strong><br>Medium deprivation: <strong>30.2%</strong><br>High deprivation: <strong>38.6%</strong> <strong>Kingswinford and South Staffordshire</strong><br>Low deprivation: <strong>73.5%</strong><br>Medium deprivation: <strong>26.5%</strong><br>High deprivation: <strong>0%</strong> <strong>Knowsley</strong><br>Low deprivation: <strong>4.8%</strong><br>Medium deprivation: <strong>22.9%</strong><br>High deprivation: <strong>72.3%</strong> <strong>Lagan Valley</strong><br>Low deprivation: <strong>0%</strong><br>Medium deprivation: <strong>75.5%</strong><br>High deprivation: <strong>24.5%</strong> <strong>Lancaster and Wyre</strong><br>Low deprivation: <strong>49.1%</strong><br>Medium deprivation: <strong>41.2%</strong><br>High deprivation: <strong>9.8%</strong> <strong>Leeds Central and Headingley</strong><br>Low deprivation: <strong>22.3%</strong><br>Medium deprivation: <strong>53.8%</strong><br>High deprivation: <strong>23.9%</strong> <strong>Leeds East</strong><br>Low deprivation: <strong>25.3%</strong><br>Medium deprivation: <strong>21.4%</strong><br>High deprivation: <strong>53.3%</strong> <strong>Leeds North East</strong><br>Low deprivation: <strong>51.5%</strong><br>Medium deprivation: <strong>22.1%</strong><br>High deprivation: <strong>26.4%</strong> <strong>Leeds North West</strong><br>Low deprivation: <strong>75.7%</strong><br>Medium deprivation: <strong>13.6%</strong><br>High deprivation: <strong>10.7%</strong> <strong>Leeds South</strong><br>Low deprivation: <strong>6.5%</strong><br>Medium deprivation: <strong>27.9%</strong><br>High deprivation: <strong>65.6%</strong> <strong>Leeds South West and Morley</strong><br>Low deprivation: <strong>25.1%</strong><br>Medium deprivation: <strong>49.5%</strong><br>High deprivation: <strong>25.4%</strong> <strong>Leeds West and Pudsey</strong><br>Low deprivation: <strong>24.2%</strong><br>Medium deprivation: <strong>38.2%</strong><br>High deprivation: <strong>37.6%</strong> <strong>Leicester East</strong><br>Low deprivation: <strong>9.5%</strong><br>Medium deprivation: <strong>63.8%</strong><br>High deprivation: <strong>26.6%</strong> <strong>Leicester South</strong><br>Low deprivation: <strong>17.9%</strong><br>Medium deprivation: <strong>46.4%</strong><br>High deprivation: <strong>35.7%</strong> <strong>Leicester West</strong><br>Low deprivation: <strong>8.6%</strong><br>Medium deprivation: <strong>48.9%</strong><br>High deprivation: <strong>42.5%</strong> <strong>Leigh and Atherton</strong><br>Low deprivation: <strong>33.5%</strong><br>Medium deprivation: <strong>30.7%</strong><br>High deprivation: <strong>35.8%</strong> <strong>Lewes</strong><br>Low deprivation: <strong>58.6%</strong><br>Medium deprivation: <strong>38.4%</strong><br>High deprivation: <strong>3.0%</strong> <strong>Lewisham East</strong><br>Low deprivation: <strong>8.0%</strong><br>Medium deprivation: <strong>59.4%</strong><br>High deprivation: <strong>32.7%</strong> <strong>Lewisham North</strong><br>Low deprivation: <strong>5.5%</strong><br>Medium deprivation: <strong>78.0%</strong><br>High deprivation: <strong>16.5%</strong> <strong>Lewisham West and East Dulwich</strong><br>Low deprivation: <strong>17.6%</strong><br>Medium deprivation: <strong>79.5%</strong><br>High deprivation: <strong>2.9%</strong> <strong>Leyton and Wanstead</strong><br>Low deprivation: <strong>29.0%</strong><br>Medium deprivation: <strong>62.7%</strong><br>High deprivation: <strong>8.3%</strong> <strong>Lichfield</strong><br>Low deprivation: <strong>75.1%</strong><br>Medium deprivation: <strong>23.2%</strong><br>High deprivation: <strong>1.7%</strong> <strong>Lincoln</strong><br>Low deprivation: <strong>36.3%</strong><br>Medium deprivation: <strong>39.4%</strong><br>High deprivation: <strong>24.3%</strong> <strong>Liverpool Garston</strong><br>Low deprivation: <strong>29.1%</strong><br>Medium deprivation: <strong>31.3%</strong><br>High deprivation: <strong>39.6%</strong> <strong>Liverpool Riverside</strong><br>Low deprivation: <strong>6.1%</strong><br>Medium deprivation: <strong>26.3%</strong><br>High deprivation: <strong>67.6%</strong> <strong>Liverpool Walton</strong><br>Low deprivation: <strong>6.6%</strong><br>Medium deprivation: <strong>17.1%</strong><br>High deprivation: <strong>76.3%</strong> <strong>Liverpool Wavertree</strong><br>Low deprivation: <strong>18.4%</strong><br>Medium deprivation: <strong>37.0%</strong><br>High deprivation: <strong>44.6%</strong> <strong>Liverpool West Derby</strong><br>Low deprivation: <strong>2.6%</strong><br>Medium deprivation: <strong>33.3%</strong><br>High deprivation: <strong>64.1%</strong> <strong>Livingston</strong><br>Low deprivation: <strong>45.3%</strong><br>Medium deprivation: <strong>43.5%</strong><br>High deprivation: <strong>11.2%</strong> <strong>Llanelli</strong><br>Low deprivation: <strong>13.7%</strong><br>Medium deprivation: <strong>70.3%</strong><br>High deprivation: <strong>16.0%</strong> <strong>Lothian East</strong><br>Low deprivation: <strong>60.7%</strong><br>Medium deprivation: <strong>34.3%</strong><br>High deprivation: <strong>5.0%</strong> <strong>Loughborough</strong><br>Low deprivation: <strong>62.1%</strong><br>Medium deprivation: <strong>35.0%</strong><br>High deprivation: <strong>2.9%</strong> <strong>Louth and Horncastle</strong><br>Low deprivation: <strong>22.1%</strong><br>Medium deprivation: <strong>60.0%</strong><br>High deprivation: <strong>17.9%</strong> <strong>Lowestoft</strong><br>Low deprivation: <strong>25.6%</strong><br>Medium deprivation: <strong>46.0%</strong><br>High deprivation: <strong>28.4%</strong> <strong>Luton North</strong><br>Low deprivation: <strong>25.2%</strong><br>Medium deprivation: <strong>58.3%</strong><br>High deprivation: <strong>16.5%</strong> <strong>Luton South and South Bedfordshire</strong><br>Low deprivation: <strong>14.0%</strong><br>Medium deprivation: <strong>48.8%</strong><br>High deprivation: <strong>37.2%</strong> <strong>Macclesfield</strong><br>Low deprivation: <strong>66.3%</strong><br>Medium deprivation: <strong>30.5%</strong><br>High deprivation: <strong>3.2%</strong> <strong>Maidenhead</strong><br>Low deprivation: <strong>84.0%</strong><br>Medium deprivation: <strong>16.0%</strong><br>High deprivation: <strong>0%</strong> <strong>Maidstone and Malling</strong><br>Low deprivation: <strong>54.6%</strong><br>Medium deprivation: <strong>40.0%</strong><br>High deprivation: <strong>5.4%</strong> <strong>Makerfield</strong><br>Low deprivation: <strong>35.7%</strong><br>Medium deprivation: <strong>37.9%</strong><br>High deprivation: <strong>26.4%</strong> <strong>Maldon</strong><br>Low deprivation: <strong>63.7%</strong><br>Medium deprivation: <strong>36.3%</strong><br>High deprivation: <strong>0%</strong> <strong>Manchester Central</strong><br>Low deprivation: <strong>4.2%</strong><br>Medium deprivation: <strong>43.0%</strong><br>High deprivation: <strong>52.8%</strong> <strong>Manchester Rusholme</strong><br>Low deprivation: <strong>0%</strong><br>Medium deprivation: <strong>52.1%</strong><br>High deprivation: <strong>47.9%</strong> <strong>Manchester Withington</strong><br>Low deprivation: <strong>23.1%</strong><br>Medium deprivation: <strong>59.7%</strong><br>High deprivation: <strong>17.2%</strong> <strong>Mansfield</strong><br>Low deprivation: <strong>25.3%</strong><br>Medium deprivation: <strong>34.9%</strong><br>High deprivation: <strong>39.8%</strong> <strong>Melksham and Devizes</strong><br>Low deprivation: <strong>67.3%</strong><br>Medium deprivation: <strong>29.6%</strong><br>High deprivation: <strong>3.1%</strong> <strong>Melton and Syston</strong><br>Low deprivation: <strong>65.3%</strong><br>Medium deprivation: <strong>34.7%</strong><br>High deprivation: <strong>0%</strong> <strong>Meriden and Solihull East</strong><br>Low deprivation: <strong>48.0%</strong><br>Medium deprivation: <strong>32.6%</strong><br>High deprivation: <strong>19.4%</strong> <strong>Merthyr Tydfil and Aberdare</strong><br>Low deprivation: <strong>10.5%</strong><br>Medium deprivation: <strong>58.5%</strong><br>High deprivation: <strong>31.0%</strong> <strong>Mid Bedfordshire</strong><br>Low deprivation: <strong>86.4%</strong><br>Medium deprivation: <strong>12.0%</strong><br>High deprivation: <strong>1.6%</strong> <strong>Mid Buckinghamshire</strong><br>Low deprivation: <strong>96.3%</strong><br>Medium deprivation: <strong>3.7%</strong><br>High deprivation: <strong>0%</strong> <strong>Mid Cheshire</strong><br>Low deprivation: <strong>48.5%</strong><br>Medium deprivation: <strong>37.6%</strong><br>High deprivation: <strong>13.9%</strong> <strong>Mid Derbyshire</strong><br>Low deprivation: <strong>81.6%</strong><br>Medium deprivation: <strong>13.4%</strong><br>High deprivation: <strong>5.1%</strong> <strong>Mid Dorset and North Poole</strong><br>Low deprivation: <strong>69.5%</strong><br>Medium deprivation: <strong>27.8%</strong><br>High deprivation: <strong>2.7%</strong> <strong>Mid Dunbartonshire</strong><br>Low deprivation: <strong>82.4%</strong><br>Medium deprivation: <strong>16.8%</strong><br>High deprivation: <strong>0.9%</strong> <strong>Mid Leicestershire</strong><br>Low deprivation: <strong>82.9%</strong><br>Medium deprivation: <strong>17.1%</strong><br>High deprivation: <strong>0%</strong> <strong>Mid Norfolk</strong><br>Low deprivation: <strong>35.2%</strong><br>Medium deprivation: <strong>60.4%</strong><br>High deprivation: <strong>4.4%</strong> <strong>Mid Sussex</strong><br>Low deprivation: <strong>86.8%</strong><br>Medium deprivation: <strong>13.2%</strong><br>High deprivation: <strong>0%</strong> <strong>Mid Ulster</strong><br>Low deprivation: <strong>0%</strong><br>Medium deprivation: <strong>24.1%</strong><br>High deprivation: <strong>75.9%</strong> <strong>Mid and South Pembrokeshire</strong><br>Low deprivation: <strong>29.3%</strong><br>Medium deprivation: <strong>57.1%</strong><br>High deprivation: <strong>13.6%</strong> <strong>Middlesbrough South and East Cleveland</strong><br>Low deprivation: <strong>37.9%</strong><br>Medium deprivation: <strong>27.3%</strong><br>High deprivation: <strong>34.7%</strong> <strong>Middlesbrough and Thornaby East</strong><br>Low deprivation: <strong>15.4%</strong><br>Medium deprivation: <strong>22.9%</strong><br>High deprivation: <strong>61.8%</strong> <strong>Midlothian</strong><br>Low deprivation: <strong>41.6%</strong><br>Medium deprivation: <strong>50.6%</strong><br>High deprivation: <strong>7.7%</strong> <strong>Milton Keynes Central</strong><br>Low deprivation: <strong>58.0%</strong><br>Medium deprivation: <strong>30.4%</strong><br>High deprivation: <strong>11.6%</strong> <strong>Milton Keynes North</strong><br>Low deprivation: <strong>54.8%</strong><br>Medium deprivation: <strong>36.8%</strong><br>High deprivation: <strong>8.4%</strong> <strong>Mitcham and Morden</strong><br>Low deprivation: <strong>37.4%</strong><br>Medium deprivation: <strong>60.3%</strong><br>High deprivation: <strong>2.3%</strong> <strong>Monmouthshire</strong><br>Low deprivation: <strong>54.7%</strong><br>Medium deprivation: <strong>45.3%</strong><br>High deprivation: <strong>0%</strong> <strong>Montgomeryshire and Glyndŵr</strong><br>Low deprivation: <strong>30.7%</strong><br>Medium deprivation: <strong>61.6%</strong><br>High deprivation: <strong>7.8%</strong> <strong>Moray West, Nairn and Strathspey</strong><br>Low deprivation: <strong>63.8%</strong><br>Medium deprivation: <strong>34.6%</strong><br>High deprivation: <strong>1.6%</strong> <strong>Morecambe and Lunesdale</strong><br>Low deprivation: <strong>44.4%</strong><br>Medium deprivation: <strong>35.5%</strong><br>High deprivation: <strong>20.1%</strong> <strong>Motherwell, Wishaw and Carluke</strong><br>Low deprivation: <strong>31.9%</strong><br>Medium deprivation: <strong>38.8%</strong><br>High deprivation: <strong>29.3%</strong> <strong>Na h-Eileanan an Iar</strong><br>Low deprivation: <strong>23.4%</strong><br>Medium deprivation: <strong>76.6%</strong><br>High deprivation: <strong>0%</strong> <strong>Neath and Swansea East</strong><br>Low deprivation: <strong>29.3%</strong><br>Medium deprivation: <strong>46.2%</strong><br>High deprivation: <strong>24.5%</strong> <strong>New Forest East</strong><br>Low deprivation: <strong>61.9%</strong><br>Medium deprivation: <strong>34.7%</strong><br>High deprivation: <strong>3.3%</strong> <strong>New Forest West</strong><br>Low deprivation: <strong>64.1%</strong><br>Medium deprivation: <strong>34.3%</strong><br>High deprivation: <strong>1.6%</strong> <strong>Newark</strong><br>Low deprivation: <strong>58.4%</strong><br>Medium deprivation: <strong>31.9%</strong><br>High deprivation: <strong>9.7%</strong> <strong>Newbury</strong><br>Low deprivation: <strong>81.4%</strong><br>Medium deprivation: <strong>17.1%</strong><br>High deprivation: <strong>1.5%</strong> <strong>Newcastle upon Tyne Central and West</strong><br>Low deprivation: <strong>10.0%</strong><br>Medium deprivation: <strong>45.9%</strong><br>High deprivation: <strong>44.1%</strong> <strong>Newcastle upon Tyne East and Wallsend</strong><br>Low deprivation: <strong>22.3%</strong><br>Medium deprivation: <strong>42.2%</strong><br>High deprivation: <strong>35.5%</strong> <strong>Newcastle upon Tyne North</strong><br>Low deprivation: <strong>58.2%</strong><br>Medium deprivation: <strong>29.7%</strong><br>High deprivation: <strong>12.1%</strong> <strong>Newcastle-under-Lyme</strong><br>Low deprivation: <strong>44.6%</strong><br>Medium deprivation: <strong>45.4%</strong><br>High deprivation: <strong>10.0%</strong> <strong>Newport East</strong><br>Low deprivation: <strong>22.4%</strong><br>Medium deprivation: <strong>32.9%</strong><br>High deprivation: <strong>44.7%</strong> <strong>Newport West and Islwyn</strong><br>Low deprivation: <strong>32.3%</strong><br>Medium deprivation: <strong>55.4%</strong><br>High deprivation: <strong>12.3%</strong> <strong>Newry and Armagh</strong><br>Low deprivation: <strong>0%</strong><br>Medium deprivation: <strong>18.0%</strong><br>High deprivation: <strong>82.0%</strong> <strong>Newton Abbot</strong><br>Low deprivation: <strong>48.5%</strong><br>Medium deprivation: <strong>49.5%</strong><br>High deprivation: <strong>2.0%</strong> <strong>Newton Aycliffe and Spennymoor</strong><br>Low deprivation: <strong>21.1%</strong><br>Medium deprivation: <strong>47.1%</strong><br>High deprivation: <strong>31.8%</strong> <strong>Normanton and Hemsworth</strong><br>Low deprivation: <strong>17.0%</strong><br>Medium deprivation: <strong>47.9%</strong><br>High deprivation: <strong>35.2%</strong> <strong>North Antrim</strong><br>Low deprivation: <strong>0%</strong><br>Medium deprivation: <strong>43.8%</strong><br>High deprivation: <strong>56.2%</strong> <strong>North Ayrshire and Arran</strong><br>Low deprivation: <strong>37.3%</strong><br>Medium deprivation: <strong>32.3%</strong><br>High deprivation: <strong>30.4%</strong> <strong>North Bedfordshire</strong><br>Low deprivation: <strong>73.1%</strong><br>Medium deprivation: <strong>26.9%</strong><br>High deprivation: <strong>0%</strong> <strong>North Cornwall</strong><br>Low deprivation: <strong>7.5%</strong><br>Medium deprivation: <strong>84.5%</strong><br>High deprivation: <strong>8.0%</strong> <strong>North Cotswolds</strong><br>Low deprivation: <strong>77.7%</strong><br>Medium deprivation: <strong>22.3%</strong><br>High deprivation: <strong>0%</strong> <strong>North Devon</strong><br>Low deprivation: <strong>36.4%</strong><br>Medium deprivation: <strong>52.3%</strong><br>High deprivation: <strong>11.4%</strong> <strong>North Dorset</strong><br>Low deprivation: <strong>45.3%</strong><br>Medium deprivation: <strong>54.7%</strong><br>High deprivation: <strong>0%</strong> <strong>North Down</strong><br>Low deprivation: <strong>0%</strong><br>Medium deprivation: <strong>62.5%</strong><br>High deprivation: <strong>37.5%</strong> <strong>North Durham</strong><br>Low deprivation: <strong>25.8%</strong><br>Medium deprivation: <strong>47.5%</strong><br>High deprivation: <strong>26.7%</strong> <strong>North East Cambridgeshire</strong><br>Low deprivation: <strong>16.7%</strong><br>Medium deprivation: <strong>64.5%</strong><br>High deprivation: <strong>18.8%</strong> <strong>North East Derbyshire</strong><br>Low deprivation: <strong>47.3%</strong><br>Medium deprivation: <strong>40.7%</strong><br>High deprivation: <strong>11.9%</strong> <strong>North East Fife</strong><br>Low deprivation: <strong>67.2%</strong><br>Medium deprivation: <strong>26.9%</strong><br>High deprivation: <strong>5.9%</strong> <strong>North East Hampshire</strong><br>Low deprivation: <strong>97.4%</strong><br>Medium deprivation: <strong>2.6%</strong><br>High deprivation: <strong>0%</strong> <strong>North East Hertfordshire</strong><br>Low deprivation: <strong>71.3%</strong><br>Medium deprivation: <strong>27.3%</strong><br>High deprivation: <strong>1.4%</strong> <strong>North East Somerset and Hanham</strong><br>Low deprivation: <strong>72.2%</strong><br>Medium deprivation: <strong>27.8%</strong><br>High deprivation: <strong>0%</strong> <strong>North Herefordshire</strong><br>Low deprivation: <strong>38.4%</strong><br>Medium deprivation: <strong>56.8%</strong><br>High deprivation: <strong>4.8%</strong> <strong>North Norfolk</strong><br>Low deprivation: <strong>8.4%</strong><br>Medium deprivation: <strong>90.3%</strong><br>High deprivation: <strong>1.2%</strong> <strong>North Northumberland</strong><br>Low deprivation: <strong>35.3%</strong><br>Medium deprivation: <strong>61.5%</strong><br>High deprivation: <strong>3.2%</strong> <strong>North Shropshire</strong><br>Low deprivation: <strong>38.3%</strong><br>Medium deprivation: <strong>56.7%</strong><br>High deprivation: <strong>5.1%</strong> <strong>North Somerset</strong><br>Low deprivation: <strong>86.5%</strong><br>Medium deprivation: <strong>13.5%</strong><br>High deprivation: <strong>0%</strong> <strong>North Warwickshire and Bedworth</strong><br>Low deprivation: <strong>35.6%</strong><br>Medium deprivation: <strong>55.7%</strong><br>High deprivation: <strong>8.8%</strong> <strong>North West Cambridgeshire</strong><br>Low deprivation: <strong>39.1%</strong><br>Medium deprivation: <strong>49.5%</strong><br>High deprivation: <strong>11.4%</strong> <strong>North West Essex</strong><br>Low deprivation: <strong>80.0%</strong><br>Medium deprivation: <strong>20.0%</strong><br>High deprivation: <strong>0%</strong> <strong>North West Hampshire</strong><br>Low deprivation: <strong>62.0%</strong><br>Medium deprivation: <strong>36.7%</strong><br>High deprivation: <strong>1.3%</strong> <strong>North West Leicestershire</strong><br>Low deprivation: <strong>65.7%</strong><br>Medium deprivation: <strong>30.9%</strong><br>High deprivation: <strong>3.4%</strong> <strong>North West Norfolk</strong><br>Low deprivation: <strong>17.3%</strong><br>Medium deprivation: <strong>63.8%</strong><br>High deprivation: <strong>19.0%</strong> <strong>Northampton North</strong><br>Low deprivation: <strong>18.5%</strong><br>Medium deprivation: <strong>49.1%</strong><br>High deprivation: <strong>32.5%</strong> <strong>Northampton South</strong><br>Low deprivation: <strong>45.9%</strong><br>Medium deprivation: <strong>39.9%</strong><br>High deprivation: <strong>14.3%</strong> <strong>Norwich North</strong><br>Low deprivation: <strong>44.3%</strong><br>Medium deprivation: <strong>32.7%</strong><br>High deprivation: <strong>23.0%</strong> <strong>Norwich South</strong><br>Low deprivation: <strong>36.8%</strong><br>Medium deprivation: <strong>32.8%</strong><br>High deprivation: <strong>30.4%</strong> <strong>Nottingham East</strong><br>Low deprivation: <strong>4.6%</strong><br>Medium deprivation: <strong>47.5%</strong><br>High deprivation: <strong>47.8%</strong> <strong>Nottingham North and Kimberley</strong><br>Low deprivation: <strong>11.8%</strong><br>Medium deprivation: <strong>30.0%</strong><br>High deprivation: <strong>58.3%</strong> <strong>Nottingham South</strong><br>Low deprivation: <strong>23.5%</strong><br>Medium deprivation: <strong>34.7%</strong><br>High deprivation: <strong>41.9%</strong> <strong>Nuneaton</strong><br>Low deprivation: <strong>32.9%</strong><br>Medium deprivation: <strong>44.4%</strong><br>High deprivation: <strong>22.7%</strong> <strong>Old Bexley and Sidcup</strong><br>Low deprivation: <strong>80.7%</strong><br>Medium deprivation: <strong>17.8%</strong><br>High deprivation: <strong>1.4%</strong> <strong>Oldham East and Saddleworth</strong><br>Low deprivation: <strong>31.2%</strong><br>Medium deprivation: <strong>20.8%</strong><br>High deprivation: <strong>48.1%</strong> <strong>Oldham West, Chadderton and Royton</strong><br>Low deprivation: <strong>11.0%</strong><br>Medium deprivation: <strong>30.3%</strong><br>High deprivation: <strong>58.7%</strong> <strong>Orkney and Shetland</strong><br>Low deprivation: <strong>68.9%</strong><br>Medium deprivation: <strong>31.1%</strong><br>High deprivation: <strong>0%</strong> <strong>Orpington</strong><br>Low deprivation: <strong>61.0%</strong><br>Medium deprivation: <strong>25.9%</strong><br>High deprivation: <strong>13.1%</strong> <strong>Ossett and Denby Dale</strong><br>Low deprivation: <strong>59.8%</strong><br>Medium deprivation: <strong>34.7%</strong><br>High deprivation: <strong>5.4%</strong> <strong>Oxford East</strong><br>Low deprivation: <strong>43.1%</strong><br>Medium deprivation: <strong>46.3%</strong><br>High deprivation: <strong>10.7%</strong> <strong>Oxford West and Abingdon</strong><br>Low deprivation: <strong>86.8%</strong><br>Medium deprivation: <strong>8.7%</strong><br>High deprivation: <strong>4.6%</strong> <strong>Paisley and Renfrewshire North</strong><br>Low deprivation: <strong>37.0%</strong><br>Medium deprivation: <strong>36.9%</strong><br>High deprivation: <strong>26.1%</strong> <strong>Paisley and Renfrewshire South</strong><br>Low deprivation: <strong>38.2%</strong><br>Medium deprivation: <strong>32.6%</strong><br>High deprivation: <strong>29.2%</strong> <strong>Peckham</strong><br>Low deprivation: <strong>0%</strong><br>Medium deprivation: <strong>62.6%</strong><br>High deprivation: <strong>37.4%</strong> <strong>Pendle and Clitheroe</strong><br>Low deprivation: <strong>37.0%</strong><br>Medium deprivation: <strong>35.0%</strong><br>High deprivation: <strong>28.0%</strong> <strong>Penistone and Stocksbridge</strong><br>Low deprivation: <strong>53.9%</strong><br>Medium deprivation: <strong>32.7%</strong><br>High deprivation: <strong>13.4%</strong> <strong>Penrith and Solway</strong><br>Low deprivation: <strong>41.5%</strong><br>Medium deprivation: <strong>53.7%</strong><br>High deprivation: <strong>4.8%</strong> <strong>Perth and Kinross-shire</strong><br>Low deprivation: <strong>68.4%</strong><br>Medium deprivation: <strong>25.8%</strong><br>High deprivation: <strong>5.8%</strong> <strong>Peterborough</strong><br>Low deprivation: <strong>13.2%</strong><br>Medium deprivation: <strong>33.8%</strong><br>High deprivation: <strong>53.0%</strong> <strong>Plymouth Moor View</strong><br>Low deprivation: <strong>18.4%</strong><br>Medium deprivation: <strong>50.5%</strong><br>High deprivation: <strong>31.1%</strong> <strong>Plymouth Sutton and Devonport</strong><br>Low deprivation: <strong>15.1%</strong><br>Medium deprivation: <strong>46.3%</strong><br>High deprivation: <strong>38.6%</strong> <strong>Pontefract, Castleford and Knottingley</strong><br>Low deprivation: <strong>22.2%</strong><br>Medium deprivation: <strong>39.3%</strong><br>High deprivation: <strong>38.5%</strong> <strong>Pontypridd</strong><br>Low deprivation: <strong>37.0%</strong><br>Medium deprivation: <strong>43.3%</strong><br>High deprivation: <strong>19.6%</strong> <strong>Poole</strong><br>Low deprivation: <strong>55.0%</strong><br>Medium deprivation: <strong>41.1%</strong><br>High deprivation: <strong>4.0%</strong> <strong>Poplar and Limehouse</strong><br>Low deprivation: <strong>23.1%</strong><br>Medium deprivation: <strong>54.9%</strong><br>High deprivation: <strong>21.9%</strong> <strong>Portsmouth North</strong><br>Low deprivation: <strong>22.1%</strong><br>Medium deprivation: <strong>50.7%</strong><br>High deprivation: <strong>27.3%</strong> <strong>Portsmouth South</strong><br>Low deprivation: <strong>7.6%</strong><br>Medium deprivation: <strong>71.1%</strong><br>High deprivation: <strong>21.4%</strong> <strong>Preston</strong><br>Low deprivation: <strong>15.8%</strong><br>Medium deprivation: <strong>33.1%</strong><br>High deprivation: <strong>51.1%</strong> <strong>Putney</strong><br>Low deprivation: <strong>51.2%</strong><br>Medium deprivation: <strong>47.1%</strong><br>High deprivation: <strong>1.7%</strong> <strong>Queen's Park and Maida Vale</strong><br>Low deprivation: <strong>12.7%</strong><br>Medium deprivation: <strong>54.0%</strong><br>High deprivation: <strong>33.3%</strong> <strong>Rawmarsh and Conisbrough</strong><br>Low deprivation: <strong>15.8%</strong><br>Medium deprivation: <strong>47.6%</strong><br>High deprivation: <strong>36.7%</strong> <strong>Rayleigh and Wickford</strong><br>Low deprivation: <strong>85.0%</strong><br>Medium deprivation: <strong>15.0%</strong><br>High deprivation: <strong>0%</strong> <strong>Reading Central</strong><br>Low deprivation: <strong>39.0%</strong><br>Medium deprivation: <strong>58.2%</strong><br>High deprivation: <strong>2.8%</strong> <strong>Reading West and Mid Berkshire</strong><br>Low deprivation: <strong>71.3%</strong><br>Medium deprivation: <strong>25.4%</strong><br>High deprivation: <strong>3.3%</strong> <strong>Redcar</strong><br>Low deprivation: <strong>24.3%</strong><br>Medium deprivation: <strong>37.8%</strong><br>High deprivation: <strong>37.9%</strong> <strong>Redditch</strong><br>Low deprivation: <strong>42.2%</strong><br>Medium deprivation: <strong>33.6%</strong><br>High deprivation: <strong>24.2%</strong> <strong>Reigate</strong><br>Low deprivation: <strong>79.8%</strong><br>Medium deprivation: <strong>20.2%</strong><br>High deprivation: <strong>0%</strong> <strong>Rhondda and Ogmore</strong><br>Low deprivation: <strong>4.6%</strong><br>Medium deprivation: <strong>60.1%</strong><br>High deprivation: <strong>35.3%</strong> <strong>Ribble Valley</strong><br>Low deprivation: <strong>68.1%</strong><br>Medium deprivation: <strong>31.9%</strong><br>High deprivation: <strong>0%</strong> <strong>Richmond Park</strong><br>Low deprivation: <strong>86.7%</strong><br>Medium deprivation: <strong>13.3%</strong><br>High deprivation: <strong>0%</strong> <strong>Richmond and Northallerton</strong><br>Low deprivation: <strong>72.2%</strong><br>Medium deprivation: <strong>27.8%</strong><br>High deprivation: <strong>0%</strong> <strong>Rochdale</strong><br>Low deprivation: <strong>14.5%</strong><br>Medium deprivation: <strong>28.8%</strong><br>High deprivation: <strong>56.6%</strong> <strong>Rochester and Strood</strong><br>Low deprivation: <strong>27.8%</strong><br>Medium deprivation: <strong>62.4%</strong><br>High deprivation: <strong>9.8%</strong> <strong>Romford</strong><br>Low deprivation: <strong>44.8%</strong><br>Medium deprivation: <strong>55.2%</strong><br>High deprivation: <strong>0%</strong> <strong>Romsey and Southampton North</strong><br>Low deprivation: <strong>72.4%</strong><br>Medium deprivation: <strong>23.3%</strong><br>High deprivation: <strong>4.3%</strong> <strong>Rossendale and Darwen</strong><br>Low deprivation: <strong>35.7%</strong><br>Medium deprivation: <strong>38.6%</strong><br>High deprivation: <strong>25.7%</strong> <strong>Rother Valley</strong><br>Low deprivation: <strong>47.9%</strong><br>Medium deprivation: <strong>30.5%</strong><br>High deprivation: <strong>21.6%</strong> <strong>Rotherham</strong><br>Low deprivation: <strong>21.1%</strong><br>Medium deprivation: <strong>30.0%</strong><br>High deprivation: <strong>48.9%</strong> <strong>Rugby</strong><br>Low deprivation: <strong>51.6%</strong><br>Medium deprivation: <strong>46.8%</strong><br>High deprivation: <strong>1.7%</strong> <strong>Ruislip, Northwood and Pinner</strong><br>Low deprivation: <strong>77.3%</strong><br>Medium deprivation: <strong>22.7%</strong><br>High deprivation: <strong>0%</strong> <strong>Runcorn and Helsby</strong><br>Low deprivation: <strong>44.5%</strong><br>Medium deprivation: <strong>18.8%</strong><br>High deprivation: <strong>36.7%</strong> <strong>Runnymede and Weybridge</strong><br>Low deprivation: <strong>75.8%</strong><br>Medium deprivation: <strong>24.2%</strong><br>High deprivation: <strong>0%</strong> <strong>Rushcliffe</strong><br>Low deprivation: <strong>94.7%</strong><br>Medium deprivation: <strong>5.3%</strong><br>High deprivation: <strong>0%</strong> <strong>Rutherglen</strong><br>Low deprivation: <strong>44.3%</strong><br>Medium deprivation: <strong>28.8%</strong><br>High deprivation: <strong>26.9%</strong> <strong>Rutland and Stamford</strong><br>Low deprivation: <strong>79.6%</strong><br>Medium deprivation: <strong>20.4%</strong><br>High deprivation: <strong>0%</strong> <strong>Salford</strong><br>Low deprivation: <strong>10.3%</strong><br>Medium deprivation: <strong>35.6%</strong><br>High deprivation: <strong>54.2%</strong> <strong>Salisbury</strong><br>Low deprivation: <strong>57.4%</strong><br>Medium deprivation: <strong>42.6%</strong><br>High deprivation: <strong>0%</strong> <strong>Scarborough and Whitby</strong><br>Low deprivation: <strong>29.8%</strong><br>Medium deprivation: <strong>43.0%</strong><br>High deprivation: <strong>27.2%</strong> <strong>Scunthorpe</strong><br>Low deprivation: <strong>32.3%</strong><br>Medium deprivation: <strong>35.2%</strong><br>High deprivation: <strong>32.5%</strong> <strong>Sefton Central</strong><br>Low deprivation: <strong>63.8%</strong><br>Medium deprivation: <strong>30.5%</strong><br>High deprivation: <strong>5.7%</strong> <strong>Selby</strong><br>Low deprivation: <strong>62.1%</strong><br>Medium deprivation: <strong>36.5%</strong><br>High deprivation: <strong>1.4%</strong> <strong>Sevenoaks</strong><br>Low deprivation: <strong>65.5%</strong><br>Medium deprivation: <strong>31.5%</strong><br>High deprivation: <strong>3.0%</strong> <strong>Sheffield Brightside and Hillsborough</strong><br>Low deprivation: <strong>7.0%</strong><br>Medium deprivation: <strong>22.7%</strong><br>High deprivation: <strong>70.3%</strong> <strong>Sheffield Central</strong><br>Low deprivation: <strong>33.5%</strong><br>Medium deprivation: <strong>52.8%</strong><br>High deprivation: <strong>13.7%</strong> <strong>Sheffield Hallam</strong><br>Low deprivation: <strong>84.6%</strong><br>Medium deprivation: <strong>14.1%</strong><br>High deprivation: <strong>1.3%</strong> <strong>Sheffield Heeley</strong><br>Low deprivation: <strong>19.2%</strong><br>Medium deprivation: <strong>34.1%</strong><br>High deprivation: <strong>46.7%</strong> <strong>Sheffield South East</strong><br>Low deprivation: <strong>21.5%</strong><br>Medium deprivation: <strong>37.5%</strong><br>High deprivation: <strong>41.0%</strong> <strong>Sherwood Forest</strong><br>Low deprivation: <strong>33.2%</strong><br>Medium deprivation: <strong>54.1%</strong><br>High deprivation: <strong>12.8%</strong> <strong>Shipley</strong><br>Low deprivation: <strong>47.4%</strong><br>Medium deprivation: <strong>38.8%</strong><br>High deprivation: <strong>13.8%</strong> <strong>Shrewsbury</strong><br>Low deprivation: <strong>49.5%</strong><br>Medium deprivation: <strong>41.9%</strong><br>High deprivation: <strong>8.6%</strong> <strong>Sittingbourne and Sheppey</strong><br>Low deprivation: <strong>19.8%</strong><br>Medium deprivation: <strong>52.0%</strong><br>High deprivation: <strong>28.2%</strong> <strong>Skipton and Ripon</strong><br>Low deprivation: <strong>72.5%</strong><br>Medium deprivation: <strong>26.4%</strong><br>High deprivation: <strong>1.1%</strong> <strong>Sleaford and North Hykeham</strong><br>Low deprivation: <strong>73.7%</strong><br>Medium deprivation: <strong>26.3%</strong><br>High deprivation: <strong>0%</strong> <strong>Slough</strong><br>Low deprivation: <strong>16.8%</strong><br>Medium deprivation: <strong>75.2%</strong><br>High deprivation: <strong>8.0%</strong> <strong>Smethwick</strong><br>Low deprivation: <strong>3.8%</strong><br>Medium deprivation: <strong>43.2%</strong><br>High deprivation: <strong>53.0%</strong> <strong>Solihull West and Shirley</strong><br>Low deprivation: <strong>69.6%</strong><br>Medium deprivation: <strong>27.4%</strong><br>High deprivation: <strong>3.0%</strong> <strong>South Antrim</strong><br>Low deprivation: <strong>0%</strong><br>Medium deprivation: <strong>68.8%</strong><br>High deprivation: <strong>31.2%</strong> <strong>South Basildon and East Thurrock</strong><br>Low deprivation: <strong>33.6%</strong><br>Medium deprivation: <strong>48.7%</strong><br>High deprivation: <strong>17.7%</strong> <strong>South Cambridgeshire</strong><br>Low deprivation: <strong>89.1%</strong><br>Medium deprivation: <strong>10.9%</strong><br>High deprivation: <strong>0%</strong> <strong>South Cotswolds</strong><br>Low deprivation: <strong>85.9%</strong><br>Medium deprivation: <strong>14.1%</strong><br>High deprivation: <strong>0%</strong> <strong>South Derbyshire</strong><br>Low deprivation: <strong>56.0%</strong><br>Medium deprivation: <strong>38.4%</strong><br>High deprivation: <strong>5.7%</strong> <strong>South Devon</strong><br>Low deprivation: <strong>34.6%</strong><br>Medium deprivation: <strong>60.8%</strong><br>High deprivation: <strong>4.6%</strong> <strong>South Dorset</strong><br>Low deprivation: <strong>35.3%</strong><br>Medium deprivation: <strong>49.6%</strong><br>High deprivation: <strong>15.1%</strong> <strong>South Down</strong><br>Low deprivation: <strong>0%</strong><br>Medium deprivation: <strong>18.4%</strong><br>High deprivation: <strong>81.6%</strong> <strong>South East Cornwall</strong><br>Low deprivation: <strong>21.8%</strong><br>Medium deprivation: <strong>68.9%</strong><br>High deprivation: <strong>9.3%</strong> <strong>South Holland and The Deepings</strong><br>Low deprivation: <strong>38.5%</strong><br>Medium deprivation: <strong>61.5%</strong><br>High deprivation: <strong>0%</strong> <strong>South Leicestershire</strong><br>Low deprivation: <strong>87.0%</strong><br>Medium deprivation: <strong>13.0%</strong><br>High deprivation: <strong>0%</strong> <strong>South Norfolk</strong><br>Low deprivation: <strong>75.2%</strong><br>Medium deprivation: <strong>24.8%</strong><br>High deprivation: <strong>0%</strong> <strong>South Northamptonshire</strong><br>Low deprivation: <strong>96.7%</strong><br>Medium deprivation: <strong>3.3%</strong><br>High deprivation: <strong>0%</strong> <strong>South Ribble</strong><br>Low deprivation: <strong>64.0%</strong><br>Medium deprivation: <strong>32.1%</strong><br>High deprivation: <strong>3.9%</strong> <strong>South Shields</strong><br>Low deprivation: <strong>19.7%</strong><br>Medium deprivation: <strong>40.2%</strong><br>High deprivation: <strong>40.1%</strong> <strong>South Shropshire</strong><br>Low deprivation: <strong>32.6%</strong><br>Medium deprivation: <strong>66.2%</strong><br>High deprivation: <strong>1.2%</strong> <strong>South Suffolk</strong><br>Low deprivation: <strong>56.8%</strong><br>Medium deprivation: <strong>43.2%</strong><br>High deprivation: <strong>0%</strong> <strong>South West Devon</strong><br>Low deprivation: <strong>78.5%</strong><br>Medium deprivation: <strong>21.5%</strong><br>High deprivation: <strong>0%</strong> <strong>South West Hertfordshire</strong><br>Low deprivation: <strong>70.6%</strong><br>Medium deprivation: <strong>27.7%</strong><br>High deprivation: <strong>1.7%</strong> <strong>South West Norfolk</strong><br>Low deprivation: <strong>17.8%</strong><br>Medium deprivation: <strong>72.2%</strong><br>High deprivation: <strong>10.0%</strong> <strong>South West Wiltshire</strong><br>Low deprivation: <strong>52.3%</strong><br>Medium deprivation: <strong>43.7%</strong><br>High deprivation: <strong>4.1%</strong> <strong>Southampton Itchen</strong><br>Low deprivation: <strong>16.3%</strong><br>Medium deprivation: <strong>58.7%</strong><br>High deprivation: <strong>25.0%</strong> <strong>Southampton Test</strong><br>Low deprivation: <strong>21.8%</strong><br>Medium deprivation: <strong>45.2%</strong><br>High deprivation: <strong>33.0%</strong> <strong>Southend East and Rochford</strong><br>Low deprivation: <strong>27.9%</strong><br>Medium deprivation: <strong>39.8%</strong><br>High deprivation: <strong>32.3%</strong> <strong>Southend West and Leigh</strong><br>Low deprivation: <strong>51.3%</strong><br>Medium deprivation: <strong>39.2%</strong><br>High deprivation: <strong>9.6%</strong> <strong>Southgate and Wood Green</strong><br>Low deprivation: <strong>27.4%</strong><br>Medium deprivation: <strong>52.6%</strong><br>High deprivation: <strong>20.0%</strong> <strong>Southport</strong><br>Low deprivation: <strong>37.1%</strong><br>Medium deprivation: <strong>50.4%</strong><br>High deprivation: <strong>12.4%</strong> <strong>Spelthorne</strong><br>Low deprivation: <strong>55.8%</strong><br>Medium deprivation: <strong>44.2%</strong><br>High deprivation: <strong>0%</strong> <strong>Spen Valley</strong><br>Low deprivation: <strong>38.2%</strong><br>Medium deprivation: <strong>46.0%</strong><br>High deprivation: <strong>15.8%</strong> <strong>St Albans</strong><br>Low deprivation: <strong>82.3%</strong><br>Medium deprivation: <strong>17.7%</strong><br>High deprivation: <strong>0%</strong> <strong>St Austell and Newquay</strong><br>Low deprivation: <strong>20.0%</strong><br>Medium deprivation: <strong>66.0%</strong><br>High deprivation: <strong>14.0%</strong> <strong>St Helens North</strong><br>Low deprivation: <strong>22.8%</strong><br>Medium deprivation: <strong>35.4%</strong><br>High deprivation: <strong>41.8%</strong> <strong>St Helens South and Whiston</strong><br>Low deprivation: <strong>18.6%</strong><br>Medium deprivation: <strong>36.2%</strong><br>High deprivation: <strong>45.3%</strong> <strong>St Ives</strong><br>Low deprivation: <strong>13.5%</strong><br>Medium deprivation: <strong>75.9%</strong><br>High deprivation: <strong>10.6%</strong> <strong>St Neots and Mid Cambridgeshire</strong><br>Low deprivation: <strong>78.5%</strong><br>Medium deprivation: <strong>21.5%</strong><br>High deprivation: <strong>0%</strong> <strong>Stafford</strong><br>Low deprivation: <strong>61.3%</strong><br>Medium deprivation: <strong>32.7%</strong><br>High deprivation: <strong>5.9%</strong> <strong>Staffordshire Moorlands</strong><br>Low deprivation: <strong>57.7%</strong><br>Medium deprivation: <strong>38.7%</strong><br>High deprivation: <strong>3.6%</strong> <strong>Stalybridge and Hyde</strong><br>Low deprivation: <strong>21.5%</strong><br>Medium deprivation: <strong>36.0%</strong><br>High deprivation: <strong>42.5%</strong> <strong>Stevenage</strong><br>Low deprivation: <strong>29.1%</strong><br>Medium deprivation: <strong>67.1%</strong><br>High deprivation: <strong>3.8%</strong> <strong>Stirling and Strathallan</strong><br>Low deprivation: <strong>69.9%</strong><br>Medium deprivation: <strong>19.3%</strong><br>High deprivation: <strong>10.9%</strong> <strong>Stockport</strong><br>Low deprivation: <strong>24.6%</strong><br>Medium deprivation: <strong>42.2%</strong><br>High deprivation: <strong>33.1%</strong> <strong>Stockton North</strong><br>Low deprivation: <strong>21.2%</strong><br>Medium deprivation: <strong>32.9%</strong><br>High deprivation: <strong>45.9%</strong> <strong>Stockton West</strong><br>Low deprivation: <strong>68.8%</strong><br>Medium deprivation: <strong>27.9%</strong><br>High deprivation: <strong>3.3%</strong> <strong>Stoke-on-Trent Central</strong><br>Low deprivation: <strong>7.1%</strong><br>Medium deprivation: <strong>35.9%</strong><br>High deprivation: <strong>57.0%</strong> <strong>Stoke-on-Trent North</strong><br>Low deprivation: <strong>15.4%</strong><br>Medium deprivation: <strong>38.0%</strong><br>High deprivation: <strong>46.6%</strong> <strong>Stoke-on-Trent South</strong><br>Low deprivation: <strong>39.3%</strong><br>Medium deprivation: <strong>32.7%</strong><br>High deprivation: <strong>28.0%</strong> <strong>Stone, Great Wyrley and Penkridge</strong><br>Low deprivation: <strong>64.9%</strong><br>Medium deprivation: <strong>35.1%</strong><br>High deprivation: <strong>0%</strong> <strong>Stourbridge</strong><br>Low deprivation: <strong>31.1%</strong><br>Medium deprivation: <strong>34.6%</strong><br>High deprivation: <strong>34.3%</strong> <strong>Strangford</strong><br>Low deprivation: <strong>0%</strong><br>Medium deprivation: <strong>41.2%</strong><br>High deprivation: <strong>58.8%</strong> <strong>Stratford and Bow</strong><br>Low deprivation: <strong>0%</strong><br>Medium deprivation: <strong>82.4%</strong><br>High deprivation: <strong>17.6%</strong> <strong>Stratford-on-Avon</strong><br>Low deprivation: <strong>76.6%</strong><br>Medium deprivation: <strong>23.4%</strong><br>High deprivation: <strong>0%</strong> <strong>Streatham and Croydon North</strong><br>Low deprivation: <strong>12.2%</strong><br>Medium deprivation: <strong>80.9%</strong><br>High deprivation: <strong>6.9%</strong> <strong>Stretford and Urmston</strong><br>Low deprivation: <strong>31.0%</strong><br>Medium deprivation: <strong>55.3%</strong><br>High deprivation: <strong>13.8%</strong> <strong>Stroud</strong><br>Low deprivation: <strong>79.8%</strong><br>Medium deprivation: <strong>20.2%</strong><br>High deprivation: <strong>0%</strong> <strong>Suffolk Coastal</strong><br>Low deprivation: <strong>45.4%</strong><br>Medium deprivation: <strong>51.3%</strong><br>High deprivation: <strong>3.3%</strong> <strong>Sunderland Central</strong><br>Low deprivation: <strong>19.8%</strong><br>Medium deprivation: <strong>40.6%</strong><br>High deprivation: <strong>39.6%</strong> <strong>Surrey Heath</strong><br>Low deprivation: <strong>84.4%</strong><br>Medium deprivation: <strong>15.6%</strong><br>High deprivation: <strong>0%</strong> <strong>Sussex Weald</strong><br>Low deprivation: <strong>69.7%</strong><br>Medium deprivation: <strong>26.1%</strong><br>High deprivation: <strong>4.3%</strong> <strong>Sutton Coldfield</strong><br>Low deprivation: <strong>67.5%</strong><br>Medium deprivation: <strong>23.3%</strong><br>High deprivation: <strong>9.1%</strong> <strong>Sutton and Cheam</strong><br>Low deprivation: <strong>82.3%</strong><br>Medium deprivation: <strong>16.4%</strong><br>High deprivation: <strong>1.3%</strong> <strong>Swansea West</strong><br>Low deprivation: <strong>23.6%</strong><br>Medium deprivation: <strong>40.5%</strong><br>High deprivation: <strong>36.0%</strong> <strong>Swindon North</strong><br>Low deprivation: <strong>62.6%</strong><br>Medium deprivation: <strong>23.1%</strong><br>High deprivation: <strong>14.3%</strong> <strong>Swindon South</strong><br>Low deprivation: <strong>48.3%</strong><br>Medium deprivation: <strong>33.8%</strong><br>High deprivation: <strong>17.9%</strong> <strong>Tamworth</strong><br>Low deprivation: <strong>40.1%</strong><br>Medium deprivation: <strong>46.7%</strong><br>High deprivation: <strong>13.2%</strong> <strong>Tatton</strong><br>Low deprivation: <strong>74.1%</strong><br>Medium deprivation: <strong>23.8%</strong><br>High deprivation: <strong>2.1%</strong> <strong>Taunton and Wellington</strong><br>Low deprivation: <strong>39.3%</strong><br>Medium deprivation: <strong>48.7%</strong><br>High deprivation: <strong>12.0%</strong> <strong>Telford</strong><br>Low deprivation: <strong>24.2%</strong><br>Medium deprivation: <strong>43.7%</strong><br>High deprivation: <strong>32.0%</strong> <strong>Tewkesbury</strong><br>Low deprivation: <strong>67.3%</strong><br>Medium deprivation: <strong>27.7%</strong><br>High deprivation: <strong>5.0%</strong> <strong>The Wrekin</strong><br>Low deprivation: <strong>45.2%</strong><br>Medium deprivation: <strong>47.3%</strong><br>High deprivation: <strong>7.4%</strong> <strong>Thirsk and Malton</strong><br>Low deprivation: <strong>42.9%</strong><br>Medium deprivation: <strong>55.7%</strong><br>High deprivation: <strong>1.5%</strong> <strong>Thornbury and Yate</strong><br>Low deprivation: <strong>74.9%</strong><br>Medium deprivation: <strong>25.1%</strong><br>High deprivation: <strong>0%</strong> <strong>Thurrock</strong><br>Low deprivation: <strong>28.3%</strong><br>Medium deprivation: <strong>58.4%</strong><br>High deprivation: <strong>13.3%</strong> <strong>Tipton and Wednesbury</strong><br>Low deprivation: <strong>4.4%</strong><br>Medium deprivation: <strong>35.4%</strong><br>High deprivation: <strong>60.2%</strong> <strong>Tiverton and Minehead</strong><br>Low deprivation: <strong>29.8%</strong><br>Medium deprivation: <strong>70.2%</strong><br>High deprivation: <strong>0%</strong> <strong>Tonbridge</strong><br>Low deprivation: <strong>69.3%</strong><br>Medium deprivation: <strong>29.0%</strong><br>High deprivation: <strong>1.7%</strong> <strong>Tooting</strong><br>Low deprivation: <strong>38.7%</strong><br>Medium deprivation: <strong>58.1%</strong><br>High deprivation: <strong>3.2%</strong> <strong>Torbay</strong><br>Low deprivation: <strong>20.9%</strong><br>Medium deprivation: <strong>53.6%</strong><br>High deprivation: <strong>25.6%</strong> <strong>Torfaen</strong><br>Low deprivation: <strong>25.2%</strong><br>Medium deprivation: <strong>49.1%</strong><br>High deprivation: <strong>25.7%</strong> <strong>Torridge and Tavistock</strong><br>Low deprivation: <strong>16.7%</strong><br>Medium deprivation: <strong>78.9%</strong><br>High deprivation: <strong>4.4%</strong> <strong>Tottenham</strong><br>Low deprivation: <strong>0%</strong><br>Medium deprivation: <strong>49.8%</strong><br>High deprivation: <strong>50.2%</strong> <strong>Truro and Falmouth</strong><br>Low deprivation: <strong>36.2%</strong><br>Medium deprivation: <strong>55.5%</strong><br>High deprivation: <strong>8.4%</strong> <strong>Tunbridge Wells</strong><br>Low deprivation: <strong>76.1%</strong><br>Medium deprivation: <strong>22.0%</strong><br>High deprivation: <strong>1.9%</strong> <strong>Twickenham</strong><br>Low deprivation: <strong>87.1%</strong><br>Medium deprivation: <strong>11.6%</strong><br>High deprivation: <strong>1.3%</strong> <strong>Tynemouth</strong><br>Low deprivation: <strong>53.3%</strong><br>Medium deprivation: <strong>22.7%</strong><br>High deprivation: <strong>24.0%</strong> <strong>Upper Bann</strong><br>Low deprivation: <strong>0%</strong><br>Medium deprivation: <strong>39.1%</strong><br>High deprivation: <strong>60.9%</strong> <strong>Uxbridge and South Ruislip</strong><br>Low deprivation: <strong>55.3%</strong><br>Medium deprivation: <strong>43.4%</strong><br>High deprivation: <strong>1.3%</strong> <strong>Vale of Glamorgan</strong><br>Low deprivation: <strong>53.1%</strong><br>Medium deprivation: <strong>29.9%</strong><br>High deprivation: <strong>17.1%</strong> <strong>Vauxhall and Camberwell Green</strong><br>Low deprivation: <strong>4.9%</strong><br>Medium deprivation: <strong>79.3%</strong><br>High deprivation: <strong>15.8%</strong> <strong>Wakefield and Rothwell</strong><br>Low deprivation: <strong>34.8%</strong><br>Medium deprivation: <strong>35.7%</strong><br>High deprivation: <strong>29.5%</strong> <strong>Wallasey</strong><br>Low deprivation: <strong>18.0%</strong><br>Medium deprivation: <strong>38.7%</strong><br>High deprivation: <strong>43.4%</strong> <strong>Walsall and Bloxwich</strong><br>Low deprivation: <strong>12.4%</strong><br>Medium deprivation: <strong>18.0%</strong><br>High deprivation: <strong>69.6%</strong> <strong>Walthamstow</strong><br>Low deprivation: <strong>2.5%</strong><br>Medium deprivation: <strong>74.4%</strong><br>High deprivation: <strong>23.1%</strong> <strong>Warrington North</strong><br>Low deprivation: <strong>40.3%</strong><br>Medium deprivation: <strong>29.7%</strong><br>High deprivation: <strong>30.0%</strong> <strong>Warrington South</strong><br>Low deprivation: <strong>65.2%</strong><br>Medium deprivation: <strong>24.6%</strong><br>High deprivation: <strong>10.2%</strong> <strong>Warwick and Leamington</strong><br>Low deprivation: <strong>66.5%</strong><br>Medium deprivation: <strong>32.2%</strong><br>High deprivation: <strong>1.3%</strong> <strong>Washington and Gateshead South</strong><br>Low deprivation: <strong>21.9%</strong><br>Medium deprivation: <strong>41.0%</strong><br>High deprivation: <strong>37.1%</strong> <strong>Watford</strong><br>Low deprivation: <strong>49.5%</strong><br>Medium deprivation: <strong>48.6%</strong><br>High deprivation: <strong>1.8%</strong> <strong>Waveney Valley</strong><br>Low deprivation: <strong>28.8%</strong><br>Medium deprivation: <strong>71.2%</strong><br>High deprivation: <strong>0%</strong> <strong>Weald of Kent</strong><br>Low deprivation: <strong>40.9%</strong><br>Medium deprivation: <strong>57.8%</strong><br>High deprivation: <strong>1.3%</strong> <strong>Wellingborough and Rushden</strong><br>Low deprivation: <strong>41.2%</strong><br>Medium deprivation: <strong>44.5%</strong><br>High deprivation: <strong>14.3%</strong> <strong>Wells and Mendip Hills</strong><br>Low deprivation: <strong>70.8%</strong><br>Medium deprivation: <strong>29.2%</strong><br>High deprivation: <strong>0%</strong> <strong>Welwyn Hatfield</strong><br>Low deprivation: <strong>54.8%</strong><br>Medium deprivation: <strong>45.2%</strong><br>High deprivation: <strong>0%</strong> <strong>West Aberdeenshire and Kincardine</strong><br>Low deprivation: <strong>94.5%</strong><br>Medium deprivation: <strong>5.5%</strong><br>High deprivation: <strong>0%</strong> <strong>West Bromwich</strong><br>Low deprivation: <strong>4.2%</strong><br>Medium deprivation: <strong>42.9%</strong><br>High deprivation: <strong>52.9%</strong> <strong>West Dorset</strong><br>Low deprivation: <strong>42.9%</strong><br>Medium deprivation: <strong>55.7%</strong><br>High deprivation: <strong>1.4%</strong> <strong>West Dunbartonshire</strong><br>Low deprivation: <strong>20.2%</strong><br>Medium deprivation: <strong>42.9%</strong><br>High deprivation: <strong>37.0%</strong> <strong>West Ham and Beckton</strong><br>Low deprivation: <strong>2.7%</strong><br>Medium deprivation: <strong>61.2%</strong><br>High deprivation: <strong>36.2%</strong> <strong>West Lancashire</strong><br>Low deprivation: <strong>48.2%</strong><br>Medium deprivation: <strong>33.6%</strong><br>High deprivation: <strong>18.2%</strong> <strong>West Suffolk</strong><br>Low deprivation: <strong>35.4%</strong><br>Medium deprivation: <strong>64.6%</strong><br>High deprivation: <strong>0%</strong> <strong>West Tyrone</strong><br>Low deprivation: <strong>0%</strong><br>Medium deprivation: <strong>5.9%</strong><br>High deprivation: <strong>94.1%</strong> <strong>West Worcestershire</strong><br>Low deprivation: <strong>52.7%</strong><br>Medium deprivation: <strong>43.8%</strong><br>High deprivation: <strong>3.5%</strong> <strong>Westmorland and Lonsdale</strong><br>Low deprivation: <strong>61.1%</strong><br>Medium deprivation: <strong>38.9%</strong><br>High deprivation: <strong>0%</strong> <strong>Weston-super-Mare</strong><br>Low deprivation: <strong>38.5%</strong><br>Medium deprivation: <strong>36.6%</strong><br>High deprivation: <strong>24.8%</strong> <strong>Wetherby and Easingwold</strong><br>Low deprivation: <strong>88.0%</strong><br>Medium deprivation: <strong>10.6%</strong><br>High deprivation: <strong>1.4%</strong> <strong>Whitehaven and Workington</strong><br>Low deprivation: <strong>26.6%</strong><br>Medium deprivation: <strong>46.9%</strong><br>High deprivation: <strong>26.5%</strong> <strong>Widnes and Halewood</strong><br>Low deprivation: <strong>25.2%</strong><br>Medium deprivation: <strong>34.1%</strong><br>High deprivation: <strong>40.7%</strong> <strong>Wigan</strong><br>Low deprivation: <strong>32.1%</strong><br>Medium deprivation: <strong>33.1%</strong><br>High deprivation: <strong>34.8%</strong> <strong>Wimbledon</strong><br>Low deprivation: <strong>84.3%</strong><br>Medium deprivation: <strong>15.7%</strong><br>High deprivation: <strong>0%</strong> <strong>Winchester</strong><br>Low deprivation: <strong>84.8%</strong><br>Medium deprivation: <strong>15.2%</strong><br>High deprivation: <strong>0%</strong> <strong>Windsor</strong><br>Low deprivation: <strong>68.9%</strong><br>Medium deprivation: <strong>29.9%</strong><br>High deprivation: <strong>1.2%</strong> <strong>Wirral West</strong><br>Low deprivation: <strong>67.2%</strong><br>Medium deprivation: <strong>23.5%</strong><br>High deprivation: <strong>9.3%</strong> <strong>Witham</strong><br>Low deprivation: <strong>59.9%</strong><br>Medium deprivation: <strong>40.1%</strong><br>High deprivation: <strong>0%</strong> <strong>Witney</strong><br>Low deprivation: <strong>89.2%</strong><br>Medium deprivation: <strong>10.8%</strong><br>High deprivation: <strong>0%</strong> <strong>Woking</strong><br>Low deprivation: <strong>75.7%</strong><br>Medium deprivation: <strong>23.0%</strong><br>High deprivation: <strong>1.3%</strong> <strong>Wokingham</strong><br>Low deprivation: <strong>95.0%</strong><br>Medium deprivation: <strong>5.0%</strong><br>High deprivation: <strong>0%</strong> <strong>Wolverhampton North East</strong><br>Low deprivation: <strong>12.5%</strong><br>Medium deprivation: <strong>36.2%</strong><br>High deprivation: <strong>51.3%</strong> <strong>Wolverhampton South East</strong><br>Low deprivation: <strong>2.4%</strong><br>Medium deprivation: <strong>22.3%</strong><br>High deprivation: <strong>75.2%</strong> <strong>Wolverhampton West</strong><br>Low deprivation: <strong>27.1%</strong><br>Medium deprivation: <strong>39.1%</strong><br>High deprivation: <strong>33.8%</strong> <strong>Worcester</strong><br>Low deprivation: <strong>47.5%</strong><br>Medium deprivation: <strong>34.9%</strong><br>High deprivation: <strong>17.6%</strong> <strong>Worsley and Eccles</strong><br>Low deprivation: <strong>35.1%</strong><br>Medium deprivation: <strong>39.7%</strong><br>High deprivation: <strong>25.1%</strong> <strong>Worthing West</strong><br>Low deprivation: <strong>48.3%</strong><br>Medium deprivation: <strong>43.5%</strong><br>High deprivation: <strong>8.2%</strong> <strong>Wrexham</strong><br>Low deprivation: <strong>46.7%</strong><br>Medium deprivation: <strong>41.2%</strong><br>High deprivation: <strong>12.0%</strong> <strong>Wycombe</strong><br>Low deprivation: <strong>55.6%</strong><br>Medium deprivation: <strong>44.4%</strong><br>High deprivation: <strong>0%</strong> <strong>Wyre Forest</strong><br>Low deprivation: <strong>35.4%</strong><br>Medium deprivation: <strong>42.9%</strong><br>High deprivation: <strong>21.7%</strong> <strong>Wythenshawe and Sale East</strong><br>Low deprivation: <strong>26.7%</strong><br>Medium deprivation: <strong>22.0%</strong><br>High deprivation: <strong>51.2%</strong> <strong>Yeovil</strong><br>Low deprivation: <strong>35.2%</strong><br>Medium deprivation: <strong>55.3%</strong><br>High deprivation: <strong>9.5%</strong> <strong>Ynys Môn</strong><br>Low deprivation: <strong>28.4%</strong><br>Medium deprivation: <strong>60.2%</strong><br>High deprivation: <strong>11.4%</strong> <strong>York Central</strong><br>Low deprivation: <strong>61.5%</strong><br>Medium deprivation: <strong>31.8%</strong><br>High deprivation: <strong>6.7%</strong> <strong>York Outer</strong><br>Low deprivation: <strong>91.5%</strong><br>Medium deprivation: <strong>7.2%</strong><br>High deprivation: <strong>1.4%</strong> Go to the start of hex cartogram Notes§
IMD scores at constituency level are created by MySociety using methodology from a paper by Gary A Abel, Matthew E Barclay, and Rupert A Payne to create a composite measure of multiple deprivation across the UK. This set of indexes follows the general convention that higher scores show 'worse' deprivation. The most deprived area is the one with the highest score.
For each nation in the UK, the relevant statistics authority has created a ranking of multiple deprivation that ranks small census areas (LSOAs in England/Wales, DZs in Scotland and SOA in Northern Ireland). There is no equivalent ranking of areas across the entire UK.
These indexes are independent and cannot be directly compared. These measures are not directly comparable because the underlying indicators and the method used to combine them are different in each case. Additionally data is collected at different times for each index. It is not directly possible to take a DataZone from Scotland and see where it would fit inside the deprivation measure in England.
However, Abel and colleagues suggests you can fudge this a bit to create a combined index that gives useful results. This repository uses this approach to create an updated index with the national indexes avaliable in Feburary 2021.
You can view maps of: IMD by LSOA in England , IMD by Data Zone in Scotland , IMD by LSOA in Wales , or IMD by small area UK-wide from CDRC . Open Data Manchester also produce a lava lamp plot of IMD and political control by English local authority .
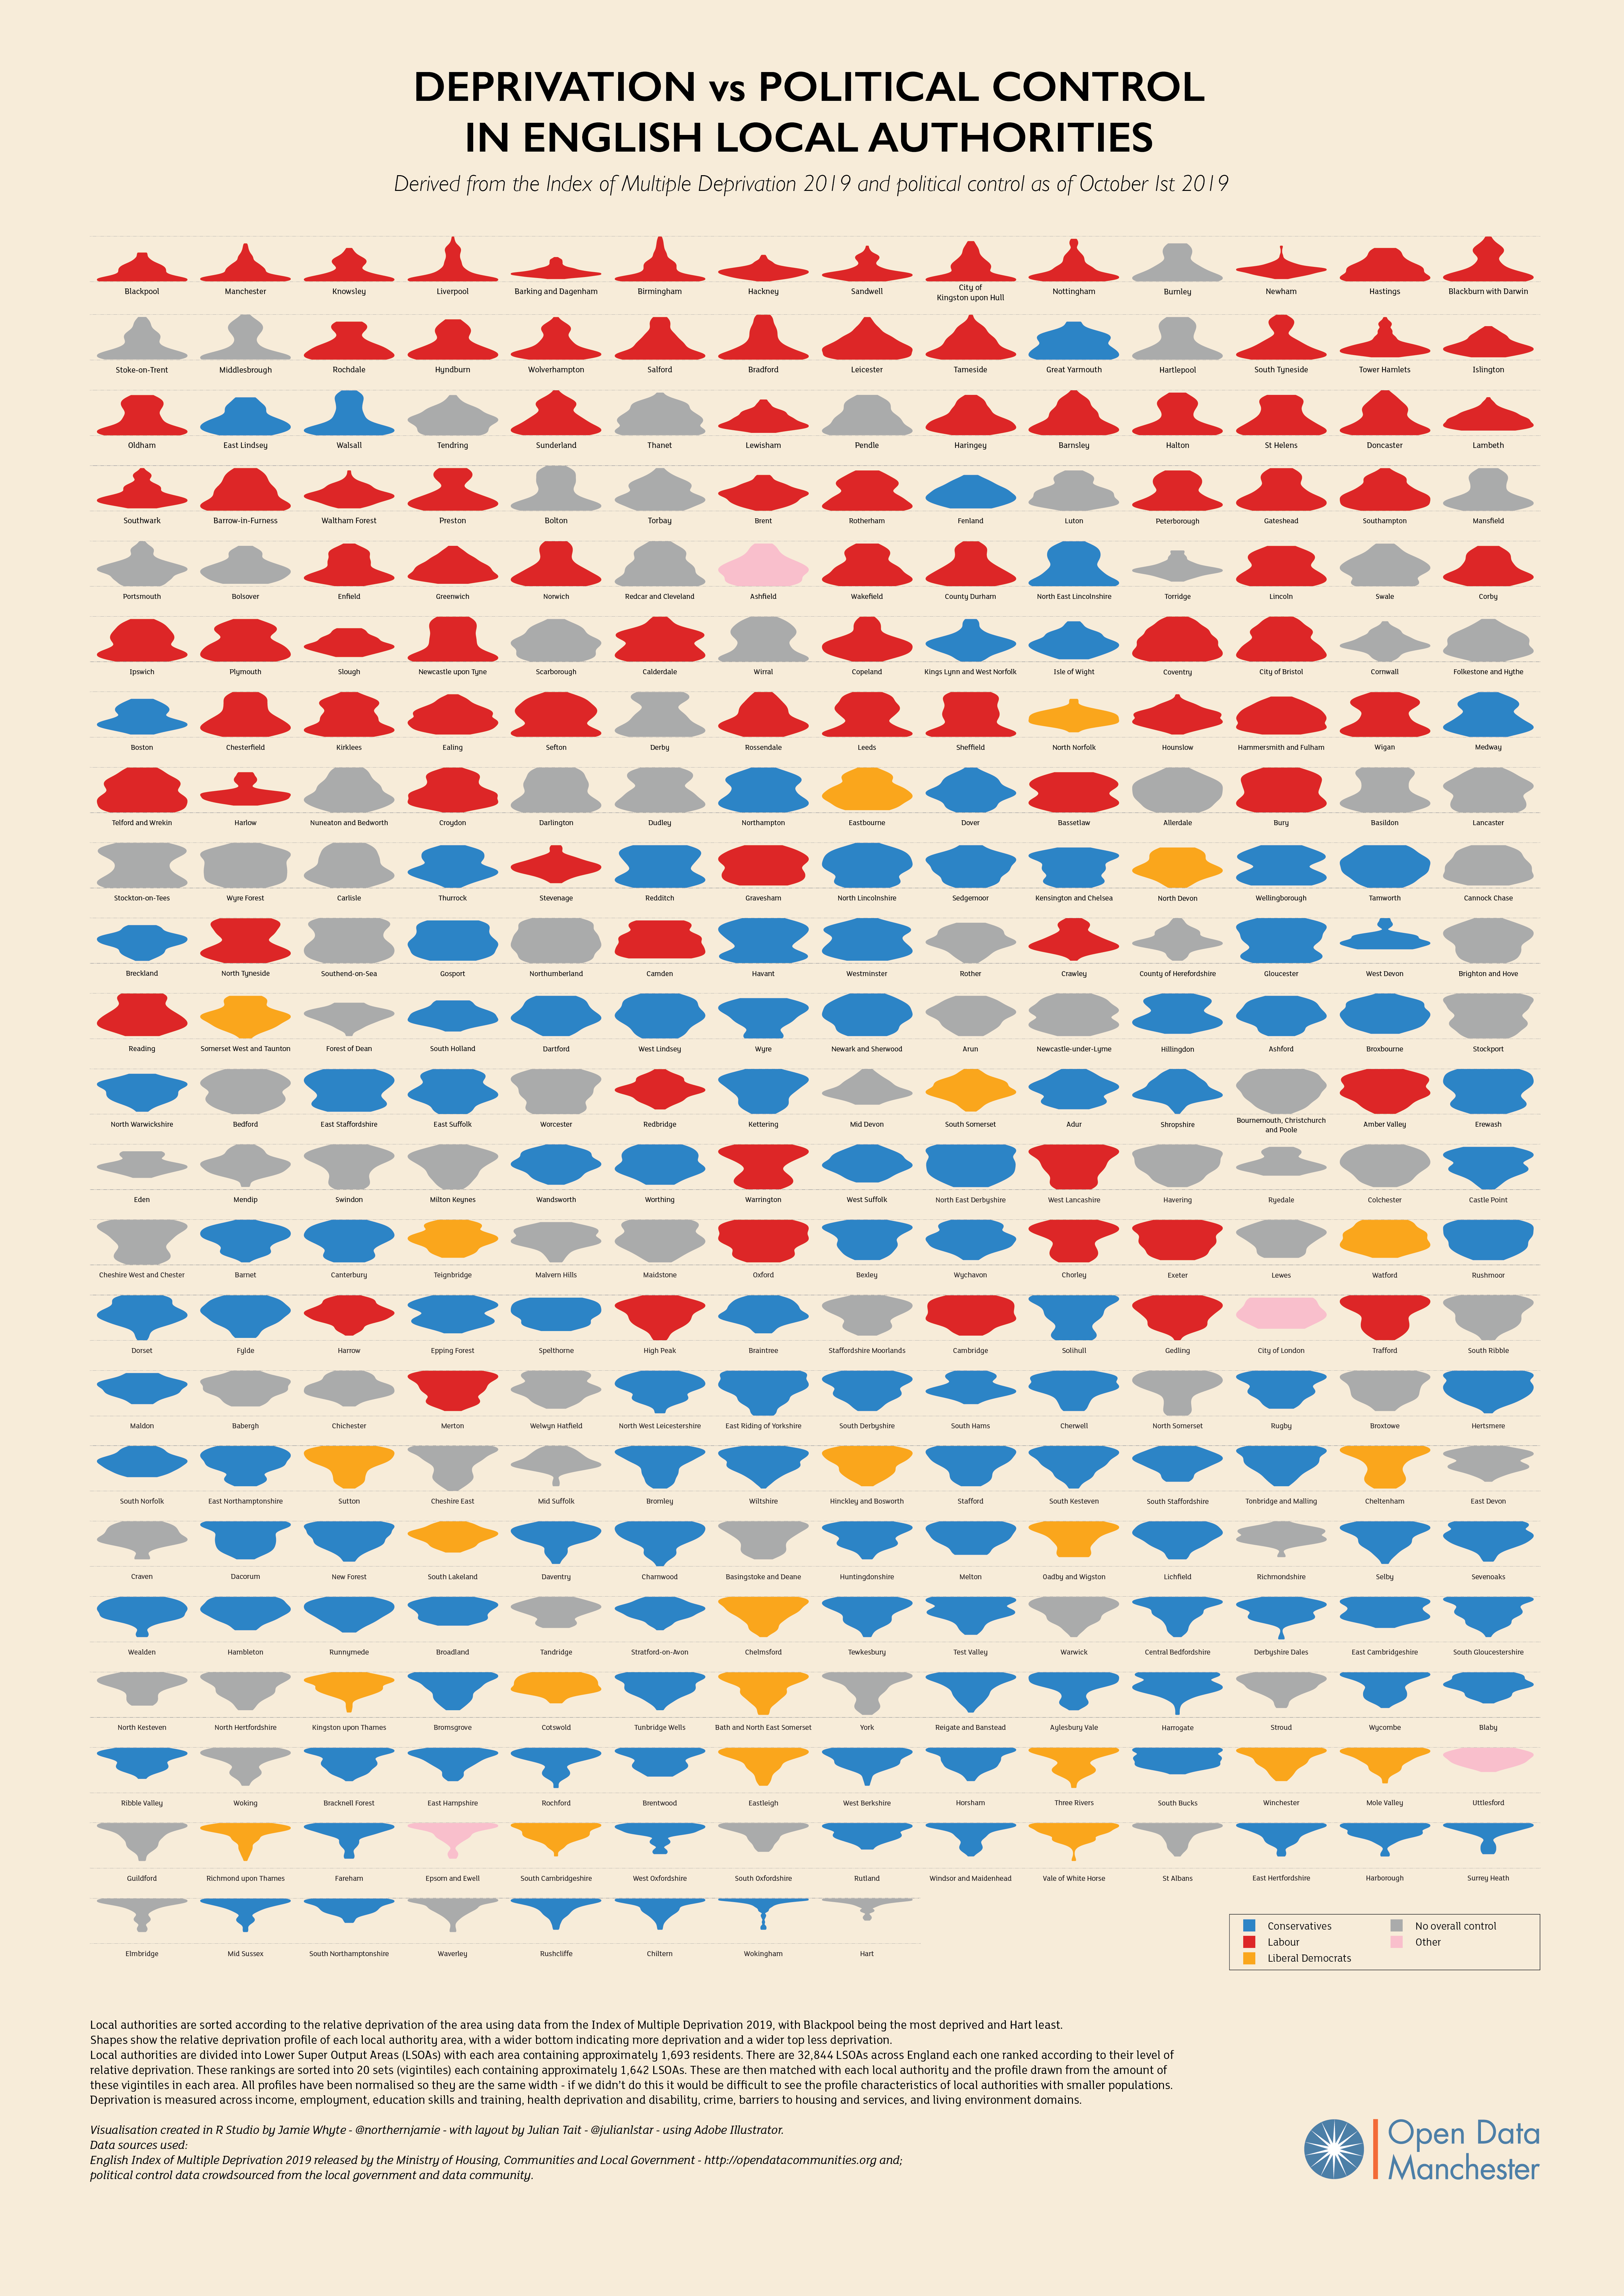